
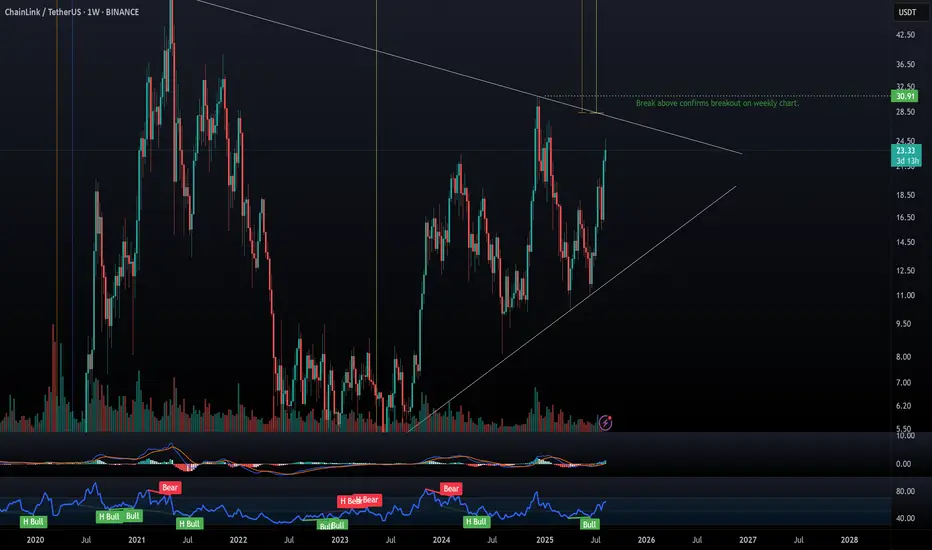
A huge bullflag pattern has formed on the weekly chart, if this breaks to the upside we could be looking a face melting targets, with the most bullish targets exceeding $1000.
I've added horizontal ray lines with highlighted price targets to the left, colour coded to the corresponding price range. Once the price breaks out of the triangle, I've also added a confirmed breakout level, which is the previous resistance line touch point.
Hopefully this plays out and we'll all buying yachts :)
I've added horizontal ray lines with highlighted price targets to the left, colour coded to the corresponding price range. Once the price breaks out of the triangle, I've also added a confirmed breakout level, which is the previous resistance line touch point.
Hopefully this plays out and we'll all buying yachts :)

免責事項
これらの情報および投稿は、TradingViewが提供または承認する金融、投資、取引、またはその他の種類の助言もしくは推奨であることを意図したものではなく、またこれらに該当するものでもありません。詳細は利用規約をご覧ください。
免責事項
これらの情報および投稿は、TradingViewが提供または承認する金融、投資、取引、またはその他の種類の助言もしくは推奨であることを意図したものではなく、またこれらに該当するものでもありません。詳細は利用規約をご覧ください。