
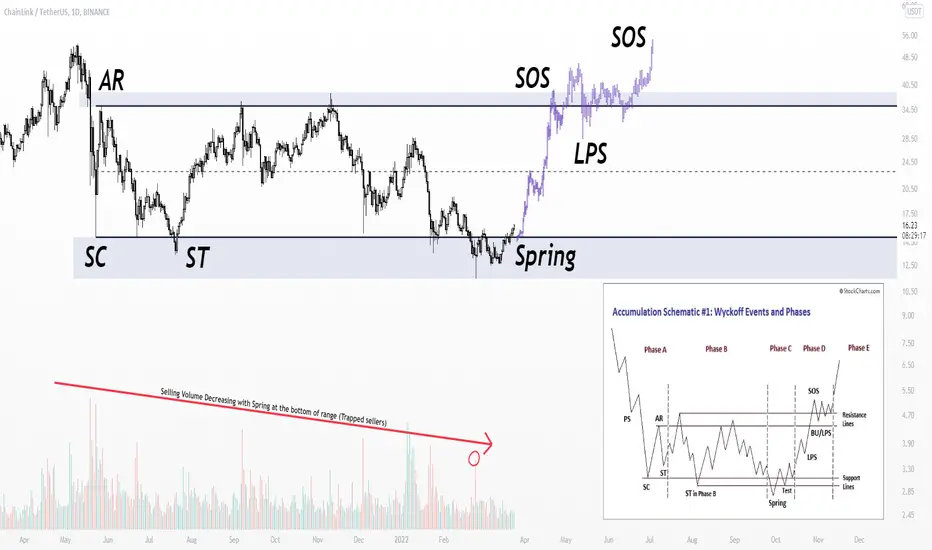
#LINK #Chainlink has been dormant and bearish for quite some time. There are a few key things to note:
1. Whales are increasing buying of the token
You can visit whalestats.com/analysis-of-the-top-100-eth-wallets to see the top ETHEREUM wallets and what they are purchasing/holding, many are starting to acquire LINK
----------------------------------------------------------------------------------------------
2. Selling volume decreasing on the chart with trapped sellers
This trading range has been going for quite some time yet the sellers were not able to secure a successful downwards breakout
----------------------------------------------------------------------------------------------
3. Fitting Wyckoff Schematic quite nicely
The Wyckoff Schematics help us identify the different between Accumulation and Distribution Trading Ranges - In a Trading Range the price Zig Zags up and down until eventually a breakout occurs, using the Wyckoff Accumulation Schematic we can see there are some clues in the similarities of the chart and the schematic that tell us LINK may be ready for a test of the upper bounds of the Trading Range.
1. Whales are increasing buying of the token
You can visit whalestats.com/analysis-of-the-top-100-eth-wallets to see the top ETHEREUM wallets and what they are purchasing/holding, many are starting to acquire LINK
----------------------------------------------------------------------------------------------
2. Selling volume decreasing on the chart with trapped sellers
This trading range has been going for quite some time yet the sellers were not able to secure a successful downwards breakout
----------------------------------------------------------------------------------------------
3. Fitting Wyckoff Schematic quite nicely
The Wyckoff Schematics help us identify the different between Accumulation and Distribution Trading Ranges - In a Trading Range the price Zig Zags up and down until eventually a breakout occurs, using the Wyckoff Accumulation Schematic we can see there are some clues in the similarities of the chart and the schematic that tell us LINK may be ready for a test of the upper bounds of the Trading Range.

関連の投稿
免責事項
これらの情報および投稿は、TradingViewが提供または承認する金融、投資、取引、またはその他の種類の助言もしくは推奨であることを意図したものではなく、またこれらに該当するものでもありません。詳細は利用規約をご覧ください。
免責事項
これらの情報および投稿は、TradingViewが提供または承認する金融、投資、取引、またはその他の種類の助言もしくは推奨であることを意図したものではなく、またこれらに該当するものでもありません。詳細は利用規約をご覧ください。