
 LINKUSDT
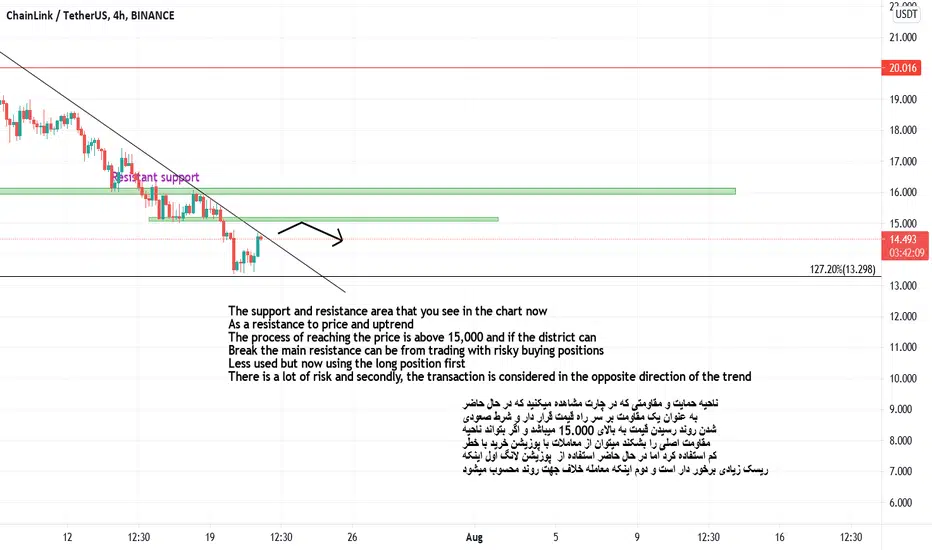
The support and resistance area that you see in the chart now
As a resistance to price and uptrend
The process of reaching the price is above 15,000 and if the district can
Break the main resistance can be from trading with risky buying positions
Less used but now using the long position first
There is a lot of risk and secondly, the transaction is considered in the opposite direction of the trend

免責事項
これらの情報および投稿は、TradingViewが提供または承認する金融、投資、取引、またはその他の種類の助言もしくは推奨であることを意図したものではなく、またこれらに該当するものでもありません。詳細は利用規約をご覧ください。
免責事項
これらの情報および投稿は、TradingViewが提供または承認する金融、投資、取引、またはその他の種類の助言もしくは推奨であることを意図したものではなく、またこれらに該当するものでもありません。詳細は利用規約をご覧ください。