
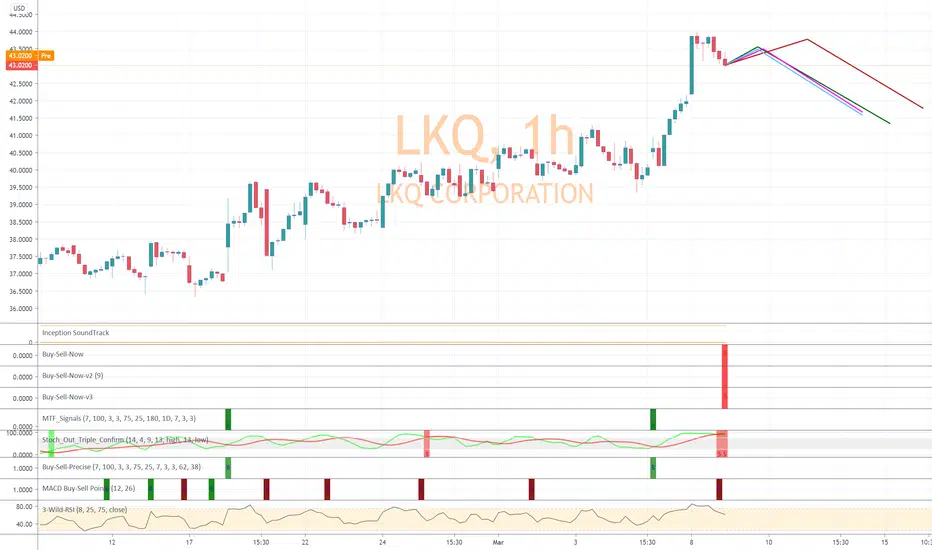
Five of our algorithms point to near-term declines for LKQ on the hourly chart. Our first algorithm (version 1) has identified this event 23 times. All 23 times the stock has dropped at least 1% over the next few days. It has dropped as much as 3% more than half the time. We are projecting slight movement up which should last no more than 2 full trading days before the decline could start. This is based on historical action of this stock when all 5 algorithms are signaled.

All forecasts are based on analysis of past behavior. Prior movements are not always indicative of future movement. Develop the theory, test the theory. Do your own research. Nothing in this analysis constitutes advice. YouTube For More. Good luck!!
関連の投稿
免責事項
これらの情報および投稿は、TradingViewが提供または承認する金融、投資、取引、またはその他の種類の助言もしくは推奨であることを意図したものではなく、またこれらに該当するものでもありません。詳細は利用規約をご覧ください。