LL - Doin' it - Finding a bottom
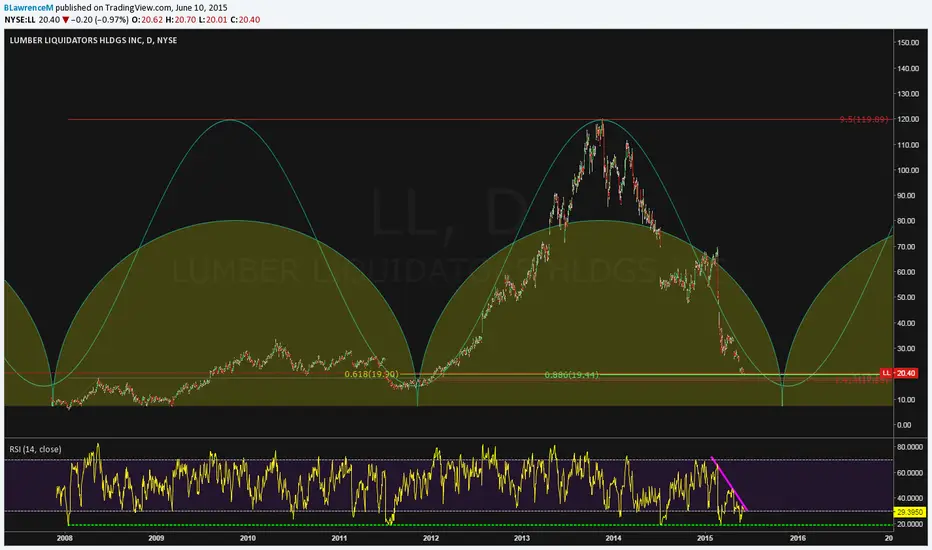
Fib, Cycle & Geometrical study
This is a chart for the trader that finds pleasure in seeing harmonic and geometric adding up.
Confluence zone in the 19.44 to 19.90 area.
RSI has been visiting the lowest of low and need to break resistens.
The stock will go through a bottoming process... in this area.
For the long term investor the timing for a buy and hold is coming up very soon.
Trade what you see!
BLawrenceM
Music at work:
youtube.com/watch?v=PFjYNJiOXtA

免責事項
これらの情報および投稿は、TradingViewが提供または承認する金融、投資、取引、またはその他の種類の助言もしくは推奨であることを意図したものではなく、またこれらに該当するものでもありません。詳細は利用規約をご覧ください。
免責事項
これらの情報および投稿は、TradingViewが提供または承認する金融、投資、取引、またはその他の種類の助言もしくは推奨であることを意図したものではなく、またこれらに該当するものでもありません。詳細は利用規約をご覧ください。