
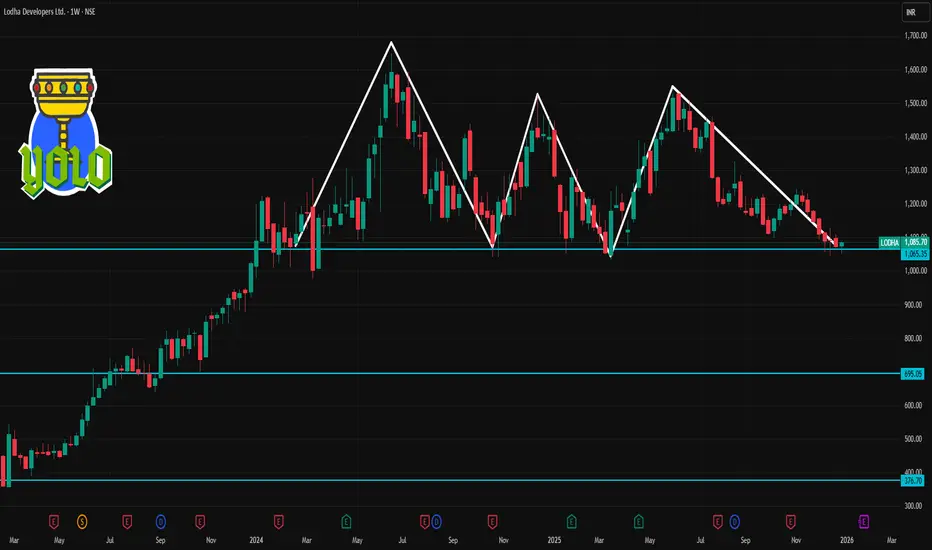
📌 Current Price Snapshot
LODHA is trading around ₹1,055 – ₹1,085 on NSE recently.
📊 Weekly Time Frame Levels (Support & Resistance)
🔹 Key Support Levels (Weekly)
Levels where price may find buying interest this week:
Support 1: ~₹1,063 – ₹1,064 (primary weekly support)
Support 2: ~₹1,060 – ₹1,061 (secondary zone)
Support 3: ~₹1,051 – ₹1,055 (deeper weekly support range)
📌 A decisive weekly close below ~₹1,050 – ₹1,055 could signal further downside momentum.
🔹 Key Resistance Levels (Weekly)
Levels where price may run into supply/selling:
Immediate Resistance / Pivot: ~₹1,077 – ₹1,082
Resistance 1: ~₹1,091 – ₹1,092
Resistance 2: ~₹1,097 – ₹1,100
Higher Resistance: ~₹1,110 + if bullish momentum accelerates
📌 Weekly close above ₹1,090 – ₹1,100 strengthens short‑term bullish bias.
📌 Weekly Trading Context
Bullish Scenario
Break & close above ~₹1,090‑₹1,100 on weekly chart → watch for continuation toward higher resistances.
Bearish Scenario
Breakdown and weekly close below ~₹1,063‑₹1,055 → could open path to deeper support near ~₹1,030‑₹1,020 in extended bearish move.
LODHA is trading around ₹1,055 – ₹1,085 on NSE recently.
📊 Weekly Time Frame Levels (Support & Resistance)
🔹 Key Support Levels (Weekly)
Levels where price may find buying interest this week:
Support 1: ~₹1,063 – ₹1,064 (primary weekly support)
Support 2: ~₹1,060 – ₹1,061 (secondary zone)
Support 3: ~₹1,051 – ₹1,055 (deeper weekly support range)
📌 A decisive weekly close below ~₹1,050 – ₹1,055 could signal further downside momentum.
🔹 Key Resistance Levels (Weekly)
Levels where price may run into supply/selling:
Immediate Resistance / Pivot: ~₹1,077 – ₹1,082
Resistance 1: ~₹1,091 – ₹1,092
Resistance 2: ~₹1,097 – ₹1,100
Higher Resistance: ~₹1,110 + if bullish momentum accelerates
📌 Weekly close above ₹1,090 – ₹1,100 strengthens short‑term bullish bias.
📌 Weekly Trading Context
Bullish Scenario
Break & close above ~₹1,090‑₹1,100 on weekly chart → watch for continuation toward higher resistances.
Bearish Scenario
Breakdown and weekly close below ~₹1,063‑₹1,055 → could open path to deeper support near ~₹1,030‑₹1,020 in extended bearish move.

Contact Knowledgehub for a detailed consultation: Dm on WhatsApp: [wa.link/a2o0kz]-
Phone No: [+91 93102 26243]-
Email: [tradingviewknowledgehub@gmail.com]---
-- Let’s achieve success together!
Phone No: [+91 93102 26243]-
Email: [tradingviewknowledgehub@gmail.com]---
-- Let’s achieve success together!
関連の投稿
免責事項
これらの情報および投稿は、TradingViewが提供または承認する金融、投資、取引、またはその他の種類の助言もしくは推奨であることを意図したものではなく、またこれらに該当するものでもありません。詳細は利用規約をご覧ください。
Contact Knowledgehub for a detailed consultation: Dm on WhatsApp: [wa.link/a2o0kz]-
Phone No: [+91 93102 26243]-
Email: [tradingviewknowledgehub@gmail.com]---
-- Let’s achieve success together!
Phone No: [+91 93102 26243]-
Email: [tradingviewknowledgehub@gmail.com]---
-- Let’s achieve success together!
関連の投稿
免責事項
これらの情報および投稿は、TradingViewが提供または承認する金融、投資、取引、またはその他の種類の助言もしくは推奨であることを意図したものではなく、またこれらに該当するものでもありません。詳細は利用規約をご覧ください。