更新済
LRC/USD
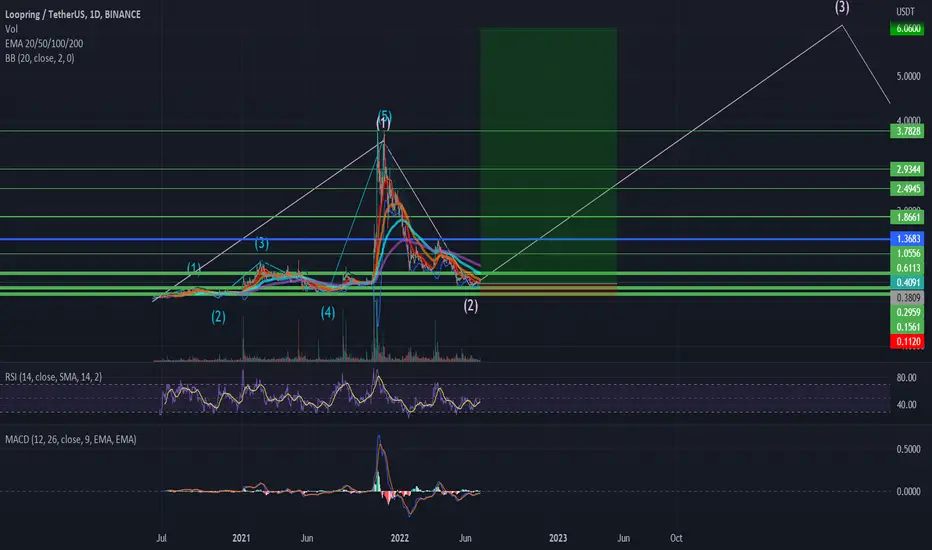
Testing/tracking elliot wave theory. Please do not trade off idea without S/L. Not financial advice.
RR: 21
Possible upside: 1490%
Possible downside: 70%
The three green thick lines are the accumulation zone. A break above the blue resistance will confirm bullish uptrend.
RR: 21
Possible upside: 1490%
Possible downside: 70%
The three green thick lines are the accumulation zone. A break above the blue resistance will confirm bullish uptrend.
トレード稼働中
The bottom is likely in or very little room for another drop. LRC has already gone through a 90% drop.ノート
The possible drop is 70%, I normally place my stop losses a bit further down that the support line to prevent getting stop loss hunted.If we get that drop, it would be a 95% drop from the ATH.
Laddering down for this coin and all others I am charting is your best option. If you get more at a 50-70% drop then the RR ratio is increased by a lot more. If this is 21 then @ a 70% drop it would be 144.
From the last support line your RR is now 144.
Possible Upside: 3100%
Possible Downside: 21%
Like WHAT???!?
Not financial advice.

免責事項
これらの情報および投稿は、TradingViewが提供または承認する金融、投資、取引、またはその他の種類の助言もしくは推奨であることを意図したものではなく、またこれらに該当するものでもありません。詳細は利用規約をご覧ください。
免責事項
これらの情報および投稿は、TradingViewが提供または承認する金融、投資、取引、またはその他の種類の助言もしくは推奨であることを意図したものではなく、またこれらに該当するものでもありません。詳細は利用規約をご覧ください。