ロング
LISK GOES UP
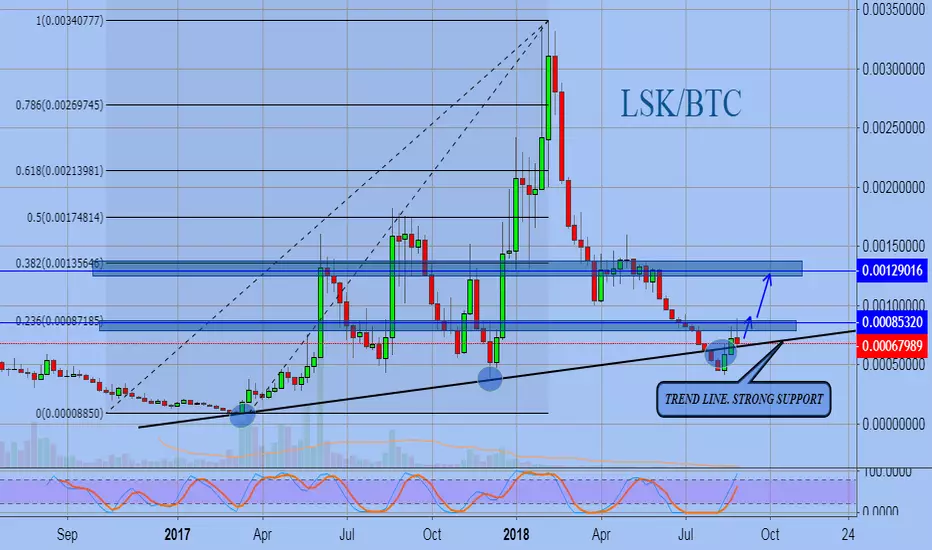
LISK is at the trend line, the chart shows the areas of contact of the support line. During the last touch, the trend line broke through, but the asset quickly returned to the growth zone.
Now the LISK is testing the support line, and then, with a high probability, it has grown at least to the 0.236 and 0.382 of the last asset growth.
Zone of resistance indicated.
Take profit - blue horizontal line
Now the LISK is testing the support line, and then, with a high probability, it has grown at least to the 0.236 and 0.382 of the last asset growth.
Zone of resistance indicated.
Take profit - blue horizontal line

免責事項
これらの情報および投稿は、TradingViewが提供または承認する金融、投資、取引、またはその他の種類の助言もしくは推奨であることを意図したものではなく、またこれらに該当するものでもありません。詳細は利用規約をご覧ください。
免責事項
これらの情報および投稿は、TradingViewが提供または承認する金融、投資、取引、またはその他の種類の助言もしくは推奨であることを意図したものではなく、またこれらに該当するものでもありません。詳細は利用規約をご覧ください。