
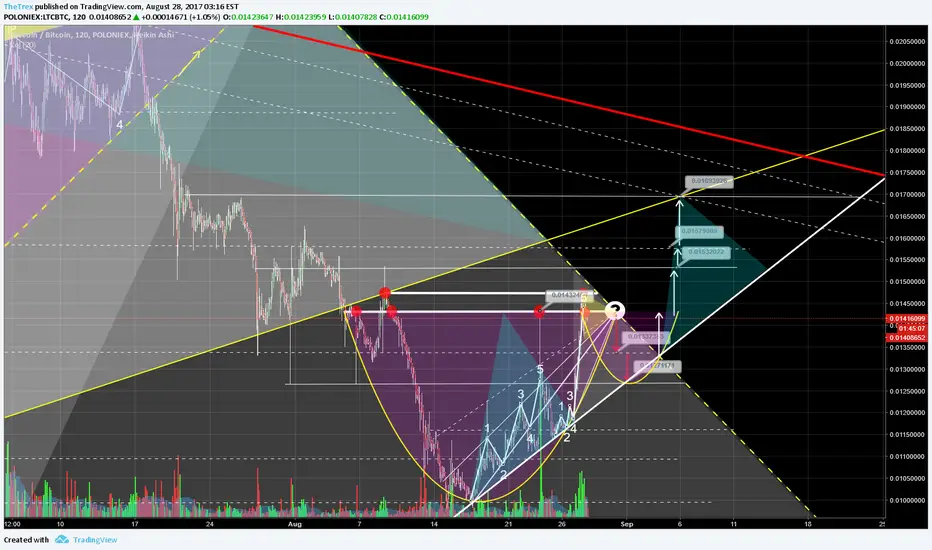
MACD and RSI 2H confirming consolidation/correction at this point, would probably be heading back to 0.01337 and this would be the bottom of the cup. Since the last uptrend went very quickly we can expect more waves bringing us to ever higher levels. The upper red line is a point where you definitely want to sell and upward momentum will slow down at this point, would be a good point to short as well.
The yellow line is also crucial, this key trend was broken and will act as strong resistance point, this could be a possible top and downtrend can continue from this point on! Therefor keep an eye on any significant volume confirmations.
The following possible target points are:
0.0143 (retest of cup lid)
0.0153
0.0157
0.0169 (Sell)
0.0185 (If shit would get crazy, short!)
I'm trading less at the moment hence there are not so many updates, but I would like to keep doing charts for fun. I will be limiting myself only to a few pairs that will be updates more consistently than many that get few updates. If you like this chart or want to see a specific pair, leave a comment. Thank your time and good luck with trading!
-TheTrex
ノート
4 September important date!ノート
ノート
Cup seems to play out as chartedノート
If we break out early of the pyramid/diagonal resistance line, then that would give us extra bullish fuel.ノート
Litecoin will break out early and not go to the bottom of the large cup. This screenshot should give some insight. ノート
Price action is getting narrow now, just keep an eye on outbreak to top or dump to bottomノート
Heading to 0.01555 broke out of triangle with full candle!トレード稼働中
ノート
ノート
The yellow diagonal line in my interactive chart is the resistance line where it will probably top off and consolidate. Target could be 0.016895ノート
Bulls eyes! Target of 0.016895 reached. Congratzノート
Wow tonight LTC hit the outermost red line.. This short term trend should definitely take some rest now and consolidate.ノート

免責事項
これらの情報および投稿は、TradingViewが提供または承認する金融、投資、取引、またはその他の種類の助言もしくは推奨であることを意図したものではなく、またこれらに該当するものでもありません。詳細は利用規約をご覧ください。
免責事項
これらの情報および投稿は、TradingViewが提供または承認する金融、投資、取引、またはその他の種類の助言もしくは推奨であることを意図したものではなく、またこれらに該当するものでもありません。詳細は利用規約をご覧ください。