
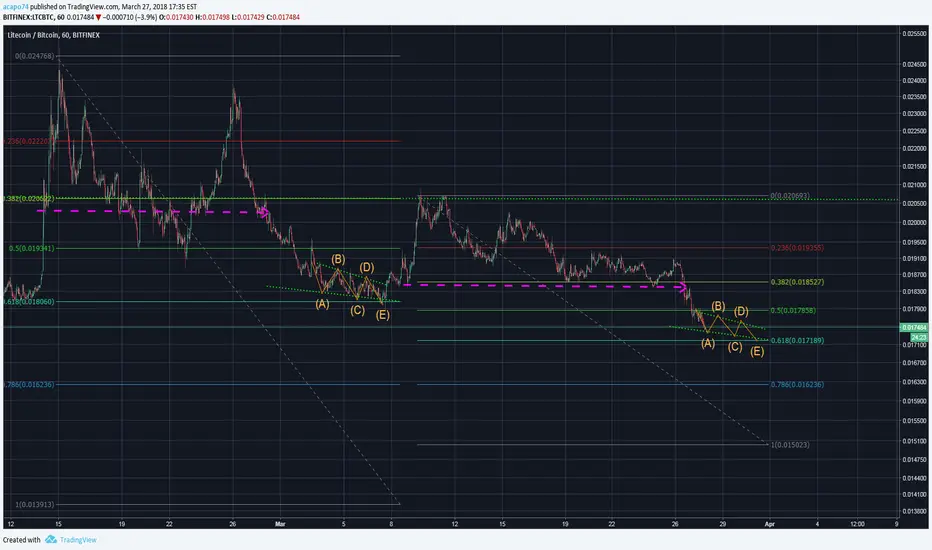
Noticed this pattern with the LTCBTC pair.
These patterns often have anomalies, outliers etc that can disrupt time intervals and construe certain price points, but for the most part they seem to stick true to where they should land.
So with that said, see a plethora of symmetry when I work on LTC graphs and there are a few of indicators here that suggest we could be seeing a near to this down after a time of consolidation (my proposed ABC wave).
As for now I will wait to see a break below this .17 level to assume further downside and the possibility of reaching the .786 fib level as shown
Thank you
These patterns often have anomalies, outliers etc that can disrupt time intervals and construe certain price points, but for the most part they seem to stick true to where they should land.
So with that said, see a plethora of symmetry when I work on LTC graphs and there are a few of indicators here that suggest we could be seeing a near to this down after a time of consolidation (my proposed ABC wave).
As for now I will wait to see a break below this .17 level to assume further downside and the possibility of reaching the .786 fib level as shown
Thank you

免責事項
これらの情報および投稿は、TradingViewが提供または承認する金融、投資、取引、またはその他の種類の助言もしくは推奨であることを意図したものではなく、またこれらに該当するものでもありません。詳細は利用規約をご覧ください。
免責事項
これらの情報および投稿は、TradingViewが提供または承認する金融、投資、取引、またはその他の種類の助言もしくは推奨であることを意図したものではなく、またこれらに該当するものでもありません。詳細は利用規約をご覧ください。