
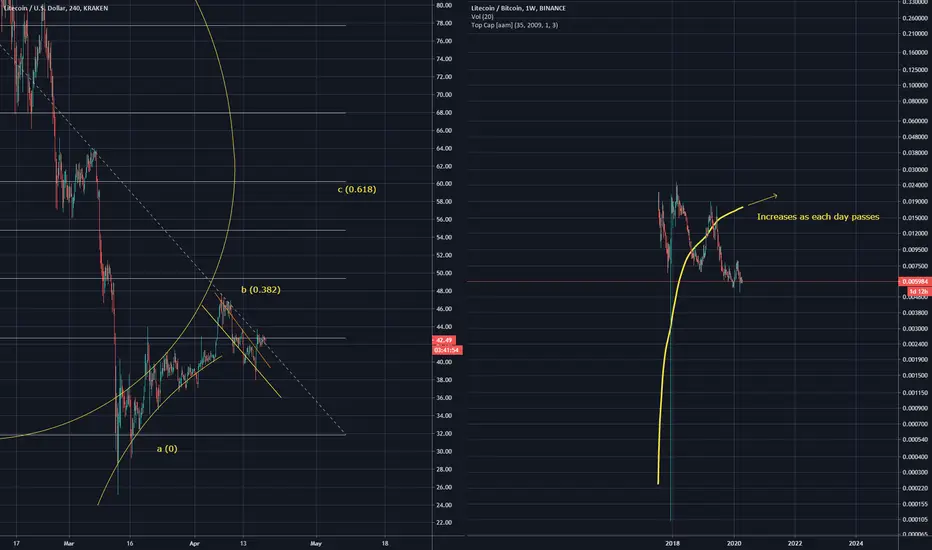
As you can see LTCUSD pair has formed an inverted ascending scallop formation against the resistance of the fibonacci spiral, broken out, formed a falling wedge and attempted to break out again. I believe this is the pullback before a larger rise, hence the C target. On the LTCBTC pair you can see the TopCap indicator showing the value of the pair at its peak, which increases as each day passes.

免責事項
これらの情報および投稿は、TradingViewが提供または承認する金融、投資、取引、またはその他の種類の助言もしくは推奨であることを意図したものではなく、またこれらに該当するものでもありません。詳細は利用規約をご覧ください。
免責事項
これらの情報および投稿は、TradingViewが提供または承認する金融、投資、取引、またはその他の種類の助言もしくは推奨であることを意図したものではなく、またこれらに該当するものでもありません。詳細は利用規約をご覧ください。