
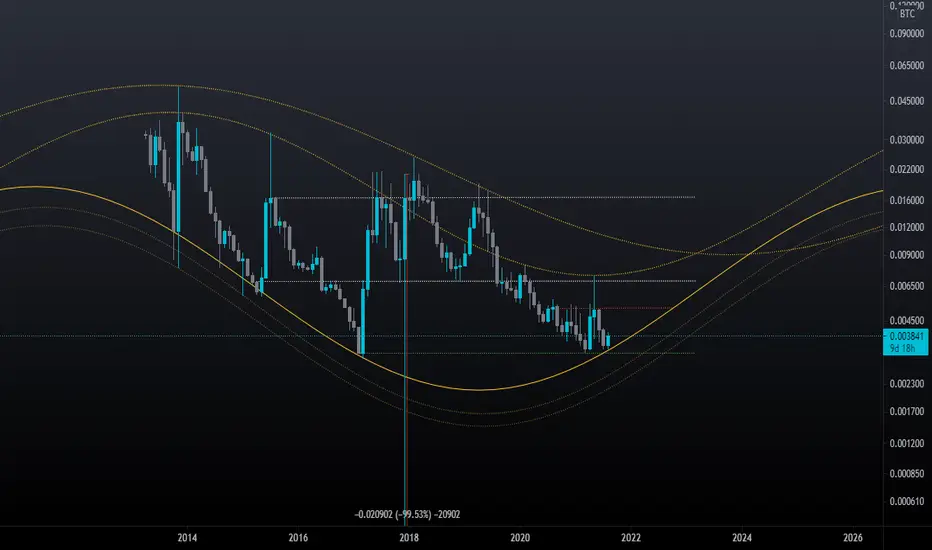
A chart missed out by many showing some bomb movement for LTC, the pump from the bottom could've been predicted by this too ;)
before dipping this might just touch 4500 sats
before dipping this might just touch 4500 sats

Don't Bet against Me
免責事項
これらの情報および投稿は、TradingViewが提供または承認する金融、投資、取引、またはその他の種類の助言もしくは推奨であることを意図したものではなく、またこれらに該当するものでもありません。詳細は利用規約をご覧ください。
Don't Bet against Me
免責事項
これらの情報および投稿は、TradingViewが提供または承認する金融、投資、取引、またはその他の種類の助言もしくは推奨であることを意図したものではなく、またこれらに該当するものでもありません。詳細は利用規約をご覧ください。