
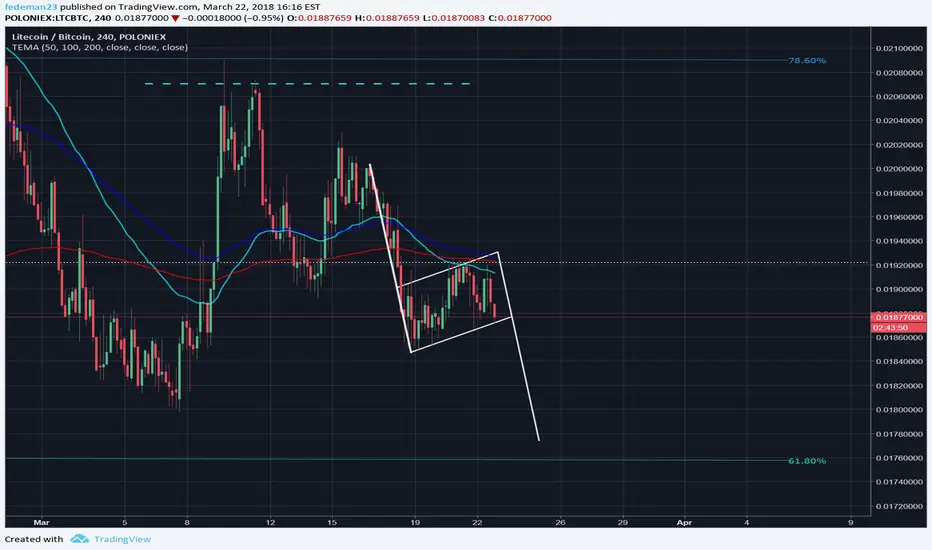
In the 4h chart it's clear a bearish flag, with LTC price that will probably touch the 100 EMA in the same zone of 61.8 Fibonacci retracement. Good coincidence, isn't it?
This is the overall picture.

If the 100 EMA does not work as a support line, expect Litecoin to touch the white drawn support line.
This is the overall picture.
If the 100 EMA does not work as a support line, expect Litecoin to touch the white drawn support line.
ノート
PS: This is a short term analysisトレード終了: 利益確定目標に到達
Told you
免責事項
これらの情報および投稿は、TradingViewが提供または承認する金融、投資、取引、またはその他の種類の助言もしくは推奨であることを意図したものではなく、またこれらに該当するものでもありません。詳細は利用規約をご覧ください。
免責事項
これらの情報および投稿は、TradingViewが提供または承認する金融、投資、取引、またはその他の種類の助言もしくは推奨であることを意図したものではなく、またこれらに該当するものでもありません。詳細は利用規約をご覧ください。