
Hi All!
Taking a break from the BTCUSD chart, as the wave between the trading zone ranges we can identify some additional opportunities to profit.
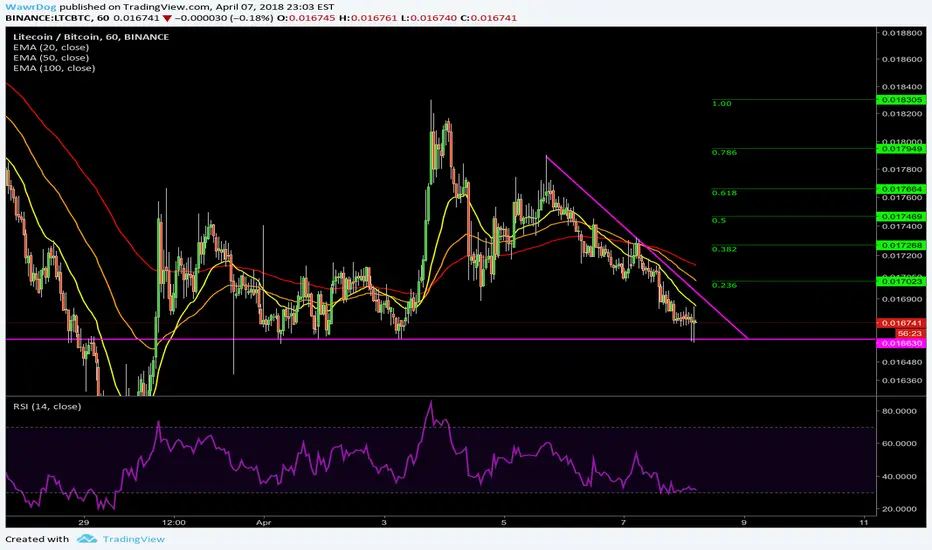
On the chart above we can see that LTCBTC is currently sitting on an accumulation line of a strong previous support level.
Trend lines are diverging and we will see a forced decision from the market in the coming hours. This looks good for a short term trade as the RSI has been bouncing around the oversold level for some time after breaching this previous resistance level (now turned support) back on the 30th of March.
Look for a breach of the downward sloping trend line followed by a retracement to the breakout zone to confirm the move upwards.
Accompany this with the cross over of the 20 EMA over the 50 EMA for confirmed entry, set exits against fibonnaci levels.
Trade Safe!
*** This is not trading or financial advice ***
ノート
Decision time coming, be ready!ノート
Breakout Confirrmed!The next potential entry will be on the retracement to the diagonal trend line, the cross over of the 20 EMA above the 50 will confirm a higher target.
ノート
Target 1 Reached (2% from breakout)ノート
Entry point tagged at 0.016920 for anyone who missed the first opportunity at the break out. Ready for lift off again, strap in.

免責事項
これらの情報および投稿は、TradingViewが提供または承認する金融、投資、取引、またはその他の種類の助言もしくは推奨であることを意図したものではなく、またこれらに該当するものでもありません。詳細は利用規約をご覧ください。
免責事項
これらの情報および投稿は、TradingViewが提供または承認する金融、投資、取引、またはその他の種類の助言もしくは推奨であることを意図したものではなく、またこれらに該当するものでもありません。詳細は利用規約をご覧ください。