
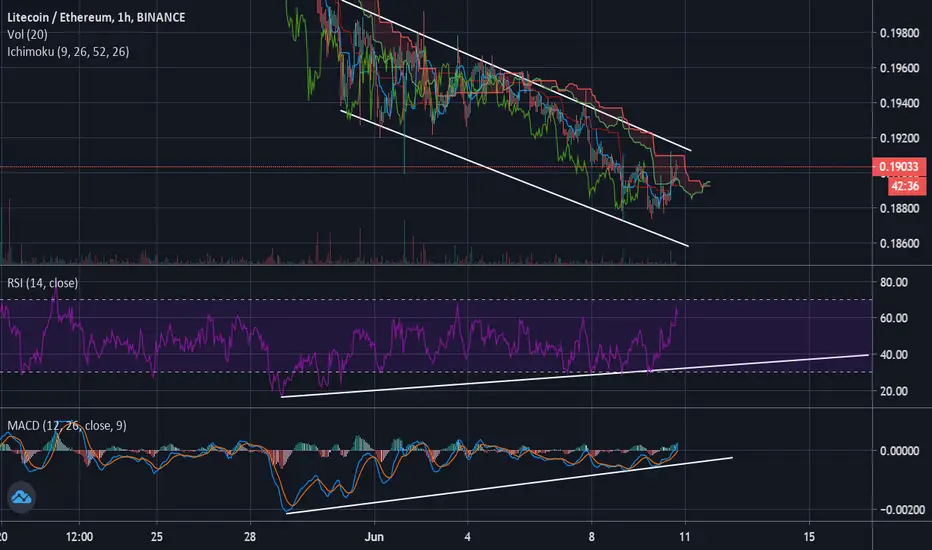
LTC were in a descending channel for a long time! I think this is the time to break it, to being in a stable rectangle channel for a while.
As you can see rsi and price are forming a hidden divergence here, price is almost touching the wedge, and macd looks strong after all.
I recommend you to do long, if you see a candle above the line.
If it failed to break the resistance, it will go down to touch the bottom.

In up trend first resistance and confirmation to long is 0.618 of extension(0.19172), and in down trend first support would be 618 of extension(0.18877)
If you liked it, please hit the like button, share and write your comments and follow me, thanks for reading.
Take care, trade safe
As you can see rsi and price are forming a hidden divergence here, price is almost touching the wedge, and macd looks strong after all.
I recommend you to do long, if you see a candle above the line.
If it failed to break the resistance, it will go down to touch the bottom.
In up trend first resistance and confirmation to long is 0.618 of extension(0.19172), and in down trend first support would be 618 of extension(0.18877)
If you liked it, please hit the like button, share and write your comments and follow me, thanks for reading.
Take care, trade safe
ノート
Shorts are still strong and downtrend is more possible, but always remember, every trend has a expire time ...It will back soon.
Good luck and always remember that, set your stop loss.
トレード終了: 利益確定目標に到達
618 => 0.18877 reached
免責事項
これらの情報および投稿は、TradingViewが提供または承認する金融、投資、取引、またはその他の種類の助言もしくは推奨であることを意図したものではなく、またこれらに該当するものでもありません。詳細は利用規約をご覧ください。
免責事項
これらの情報および投稿は、TradingViewが提供または承認する金融、投資、取引、またはその他の種類の助言もしくは推奨であることを意図したものではなく、またこれらに該当するものでもありません。詳細は利用規約をご覧ください。