
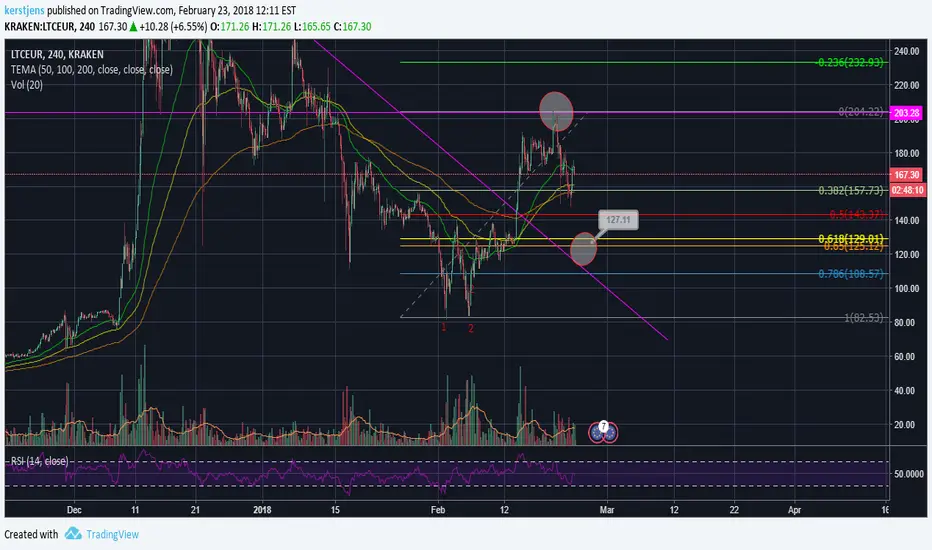
Litecoin looks very optimistic, however, due to Litecoin Cash pump I expect a thorough retracement atleast until Fib 0.618.
There was a clear double bottom for LTC and afterwards a nice pump into a 5 wave structure. It went right up to the point where it last collapsed 15 January shown by the upper red ball. The thick purple line shows that we break through the longer term bearish trend line, therefore I think we are in the correction of the first bull wave.
RSI is bearish down sloping
Buy; from 130 -113 euro (previous bearish trend line)
At the Fib levels, look for reversal trend signs in order to confirm and buy.
Requests for any euro pairs? Let me know in comments!
There was a clear double bottom for LTC and afterwards a nice pump into a 5 wave structure. It went right up to the point where it last collapsed 15 January shown by the upper red ball. The thick purple line shows that we break through the longer term bearish trend line, therefore I think we are in the correction of the first bull wave.
RSI is bearish down sloping
Buy; from 130 -113 euro (previous bearish trend line)
At the Fib levels, look for reversal trend signs in order to confirm and buy.
Requests for any euro pairs? Let me know in comments!
ノート
Okay guys, it has been a while for this update but it seems the LTC is in its C wave correcting to the target levels I set before.トレード終了: 利益確定目標に到達
I have to work on my timing but, man it hits the target perfectly on the fib 0.618トレード終了: 利益確定目標に到達
Be wary for another drop though. I do not rule out for LTC to hit the Fib 0.786 which goes well with the 17 January low as resistance.
関連の投稿
免責事項
これらの情報および投稿は、TradingViewが提供または承認する金融、投資、取引、またはその他の種類の助言もしくは推奨であることを意図したものではなく、またこれらに該当するものでもありません。詳細は利用規約をご覧ください。
免責事項
これらの情報および投稿は、TradingViewが提供または承認する金融、投資、取引、またはその他の種類の助言もしくは推奨であることを意図したものではなく、またこれらに該当するものでもありません。詳細は利用規約をご覧ください。