ロング
LTC Possible Large Move
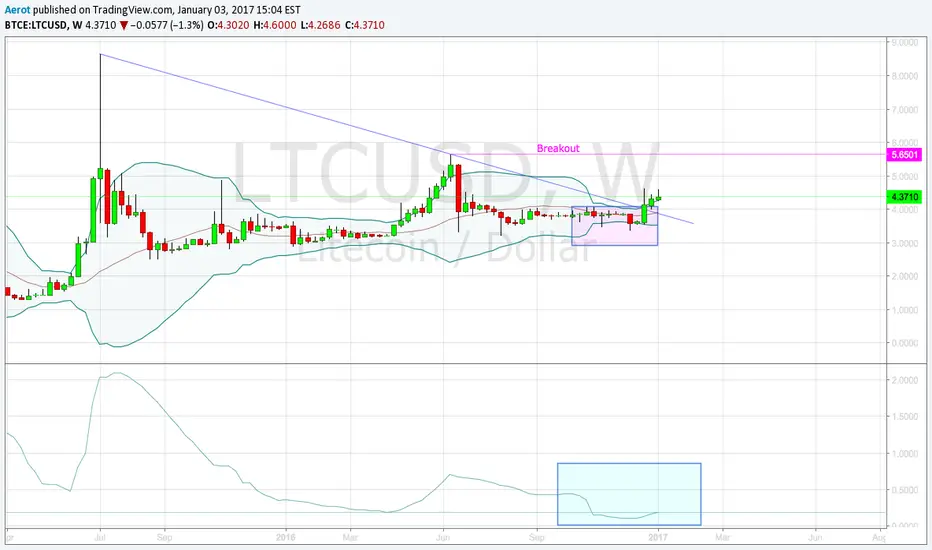
LTC has been a weird one chart wise up through this time.
Bollinger Band analysis seems to provide the clearest insight into a potential pop.
Note:
Bollinger Band analysis seems to provide the clearest insight into a potential pop.
Note:
- Head fake - Bearish candles hit bottom BB and found support to bounce from (Pink Box)
- BBW is at a lower extreme (Blue Box) - the tightening of the bands should open up and give way to upward movement
- Look for weekly close above upper BB
ノート
Drawn out quite a bit longer than I had expected, but it looks as though we are beginning to see action towards a strong breakout move.トレード稼働中
;*ノート
Position has been accumulated. I will be adding more based on the price context as we progress. First and second targets remain $5.386 and $6.761 respectively (pink lines). If we make it all the way through the orange this should actually get fun.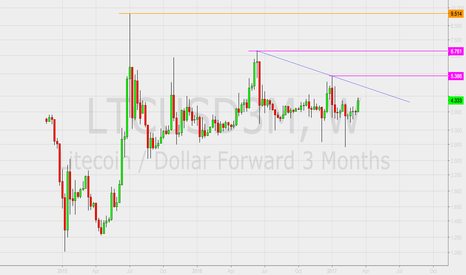
ノート
Daily view to follow better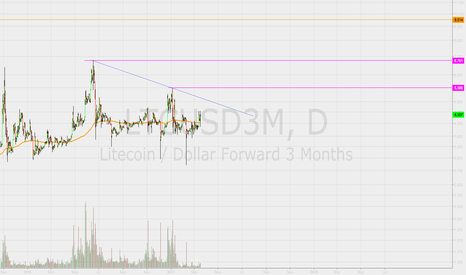
手動でトレードを終了しました
Big dumps across the board. Time to watch da red and reset.トレード稼働中
Opening back up long down here. Today's dips seem more and more of just minor correction. Will re-evaluate completely if we get some real heavy down.
関連の投稿
免責事項
これらの情報および投稿は、TradingViewが提供または承認する金融、投資、取引、またはその他の種類の助言もしくは推奨であることを意図したものではなく、またこれらに該当するものでもありません。詳細は利用規約をご覧ください。
免責事項
これらの情報および投稿は、TradingViewが提供または承認する金融、投資、取引、またはその他の種類の助言もしくは推奨であることを意図したものではなく、またこれらに該当するものでもありません。詳細は利用規約をご覧ください。