
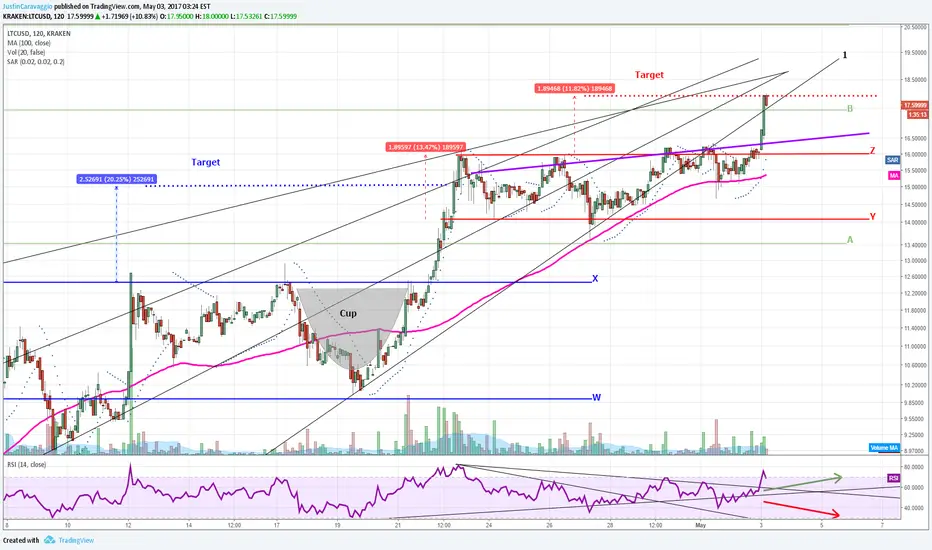
Red target set earlier today has just been touched after a ltcusd breakout on high volume
Lines 1 and B represent short term support.
The purple line represents a potential inverted head and shoulders, forecasting a similar move to the red target (set by the red rectangle pattern)
Lines 1 and B represent short term support.
The purple line represents a potential inverted head and shoulders, forecasting a similar move to the red target (set by the red rectangle pattern)

免責事項
これらの情報および投稿は、TradingViewが提供または承認する金融、投資、取引、またはその他の種類の助言もしくは推奨であることを意図したものではなく、またこれらに該当するものでもありません。詳細は利用規約をご覧ください。
免責事項
これらの情報および投稿は、TradingViewが提供または承認する金融、投資、取引、またはその他の種類の助言もしくは推奨であることを意図したものではなく、またこれらに該当するものでもありません。詳細は利用規約をご覧ください。