
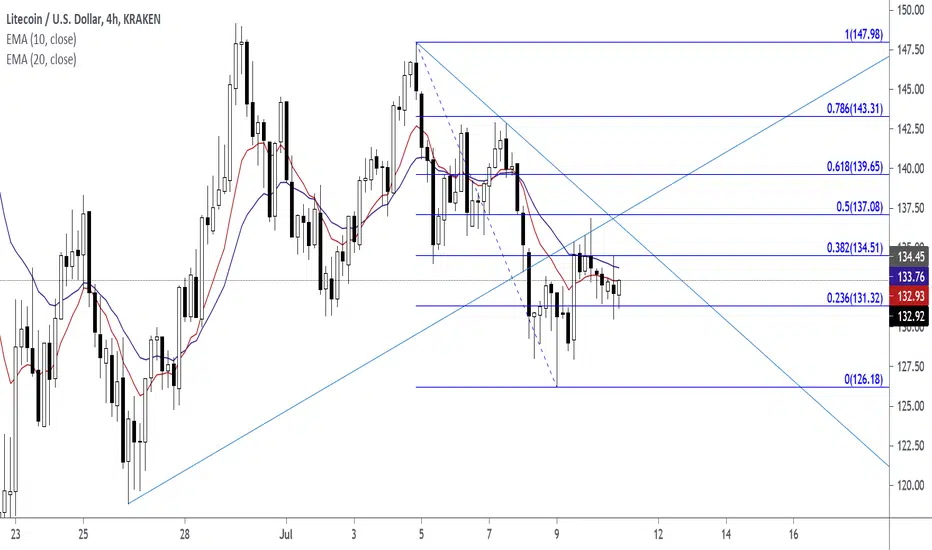
LTCUSD. Ideal entry is at the 0.382 Fibonacci Level. The Pin Bar close near that level. There was a gap that occurred on July 8, 2021 at 03:00. The gap represented horizontal support resistance level. Price closed in the area of the EMA 10 EMA 20. Price closed below diagonal trend level and retested that diagonal level as new resistance.
Confluence:
Diagonal Trend Line Level
Gap (Horizontal Support Resistance Line Level)
Fibonacci Retracement Level
EMA 10 Dynamic Support Resistance Level
EMA 20 Dynamic Support Resistance Level
Pin Bar at Lower High
Confluence:
Diagonal Trend Line Level
Gap (Horizontal Support Resistance Line Level)
Fibonacci Retracement Level
EMA 10 Dynamic Support Resistance Level
EMA 20 Dynamic Support Resistance Level
Pin Bar at Lower High

免責事項
これらの情報および投稿は、TradingViewが提供または承認する金融、投資、取引、またはその他の種類の助言もしくは推奨であることを意図したものではなく、またこれらに該当するものでもありません。詳細は利用規約をご覧ください。
免責事項
これらの情報および投稿は、TradingViewが提供または承認する金融、投資、取引、またはその他の種類の助言もしくは推奨であることを意図したものではなく、またこれらに該当するものでもありません。詳細は利用規約をご覧ください。