
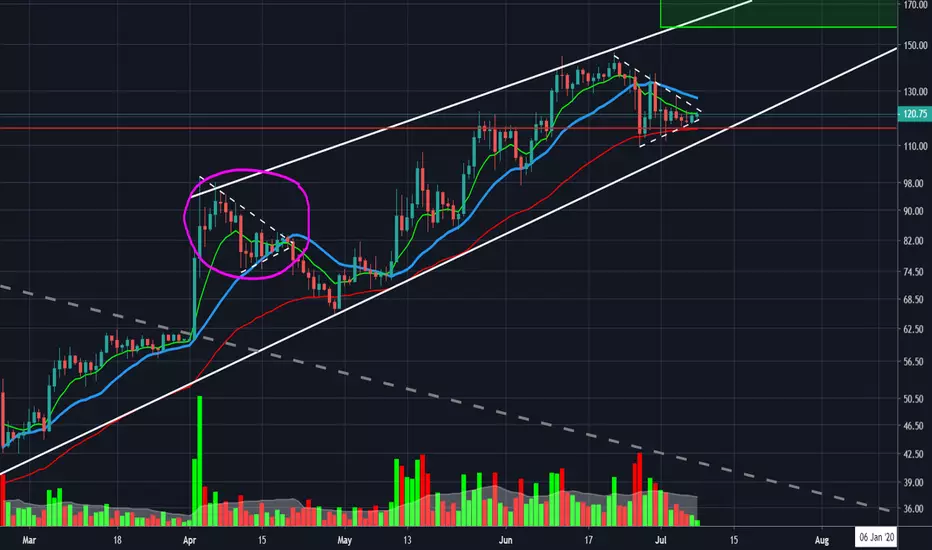
Litecoin (LTC) has managed to hold the 55 ema level for several days and as you can see from the triangle pattern forming, LTC seems to be storing energy for a move (either to the upside or downside).
On the weekly chart LTC has fallen back to the 9 ema, which has historically acted as the first line for major support, during the 2017 bull run LTC fell to the 9 ema and during more severe pullbacks, the 20 ma, a breach of the 20 ma signified the end of the bull run and a switch to a bear market. Needless to say these weekly levels are must hold points.
Rest assured i do not think a bearish reversal is on the cards, however bear in mind that a fall to the 20 ma on the weekly would entail a retracement back to the $90-$95 USD level.
The more likely outcome is that LTC could potential fall back to the lower trend line, or even slightly below, before a bounce and a continued rally to the next Fib level around the $170 USD mark. This pullback pattern has occurred before (circled area).
Keep an eye on LTC, as the chart is suggesting that a major move is on the cards and my guess would be that a slight dip to the trend line, followed by a move higher is more likely.
On the weekly chart LTC has fallen back to the 9 ema, which has historically acted as the first line for major support, during the 2017 bull run LTC fell to the 9 ema and during more severe pullbacks, the 20 ma, a breach of the 20 ma signified the end of the bull run and a switch to a bear market. Needless to say these weekly levels are must hold points.
Rest assured i do not think a bearish reversal is on the cards, however bear in mind that a fall to the 20 ma on the weekly would entail a retracement back to the $90-$95 USD level.
The more likely outcome is that LTC could potential fall back to the lower trend line, or even slightly below, before a bounce and a continued rally to the next Fib level around the $170 USD mark. This pullback pattern has occurred before (circled area).
Keep an eye on LTC, as the chart is suggesting that a major move is on the cards and my guess would be that a slight dip to the trend line, followed by a move higher is more likely.

For more analysis, consider joining our telegram group for trade updates and ongoing opportunities, link in my profile.
免責事項
これらの情報および投稿は、TradingViewが提供または承認する金融、投資、取引、またはその他の種類の助言もしくは推奨であることを意図したものではなく、またこれらに該当するものでもありません。詳細は利用規約をご覧ください。
For more analysis, consider joining our telegram group for trade updates and ongoing opportunities, link in my profile.
免責事項
これらの情報および投稿は、TradingViewが提供または承認する金融、投資、取引、またはその他の種類の助言もしくは推奨であることを意図したものではなく、またこれらに該当するものでもありません。詳細は利用規約をご覧ください。