
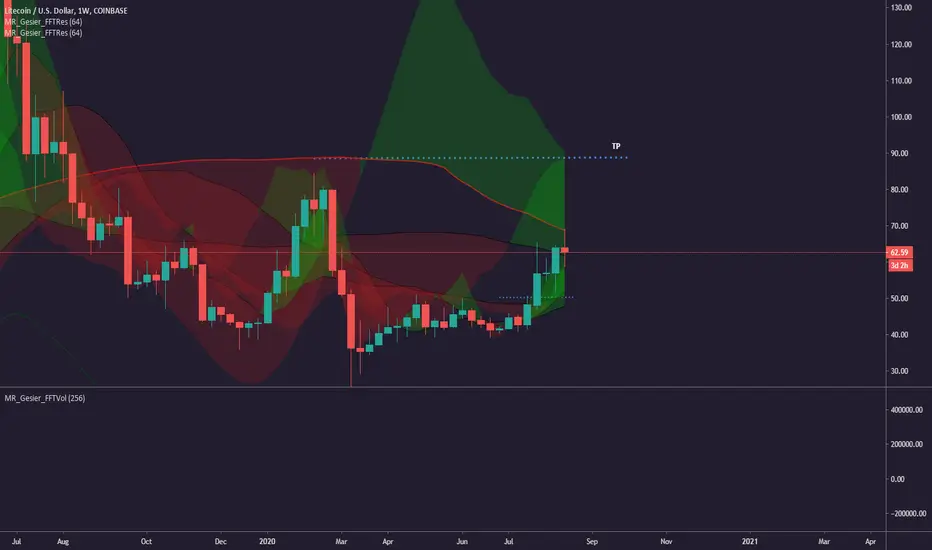
Weekly mapping of the price, we map, forecast not predict in Multi UT analysis ;)
Will depend mostly on weekly closure above the MA (watch out DXY correlation negative).
Some rules to understand the form of the strategy: (Can answer to your question about the content of DFT strategy :) )
- shade of red trends = primary (the black one are secondary trends)
- Redish trends is primary as medium investors are arbitring short/long term investors decisions.
Div: Trend vs demand/supply
-Ascending trends with red cloud is most likely tested twice before break up.
-Descending trends with green cloud is most likely tested twice before break up.
Conv: Trend vs demand/supply
-Ascending trends with green cloud doesn't need retest to break up.
-Descending trends with red cloud doesn't need retest to break down.
red cloud = supply area (Ma max negative dispersion)
green cloud = demand area (MA max postive dispersion)
node = lowest uncertainty point & supply=demand
Will depend mostly on weekly closure above the MA (watch out DXY correlation negative).
Some rules to understand the form of the strategy: (Can answer to your question about the content of DFT strategy :) )
- shade of red trends = primary (the black one are secondary trends)
- Redish trends is primary as medium investors are arbitring short/long term investors decisions.
Div: Trend vs demand/supply
-Ascending trends with red cloud is most likely tested twice before break up.
-Descending trends with green cloud is most likely tested twice before break up.
Conv: Trend vs demand/supply
-Ascending trends with green cloud doesn't need retest to break up.
-Descending trends with red cloud doesn't need retest to break down.
red cloud = supply area (Ma max negative dispersion)
green cloud = demand area (MA max postive dispersion)
node = lowest uncertainty point & supply=demand

免責事項
これらの情報および投稿は、TradingViewが提供または承認する金融、投資、取引、またはその他の種類の助言もしくは推奨であることを意図したものではなく、またこれらに該当するものでもありません。詳細は利用規約をご覧ください。
免責事項
これらの情報および投稿は、TradingViewが提供または承認する金融、投資、取引、またはその他の種類の助言もしくは推奨であることを意図したものではなく、またこれらに該当するものでもありません。詳細は利用規約をご覧ください。