
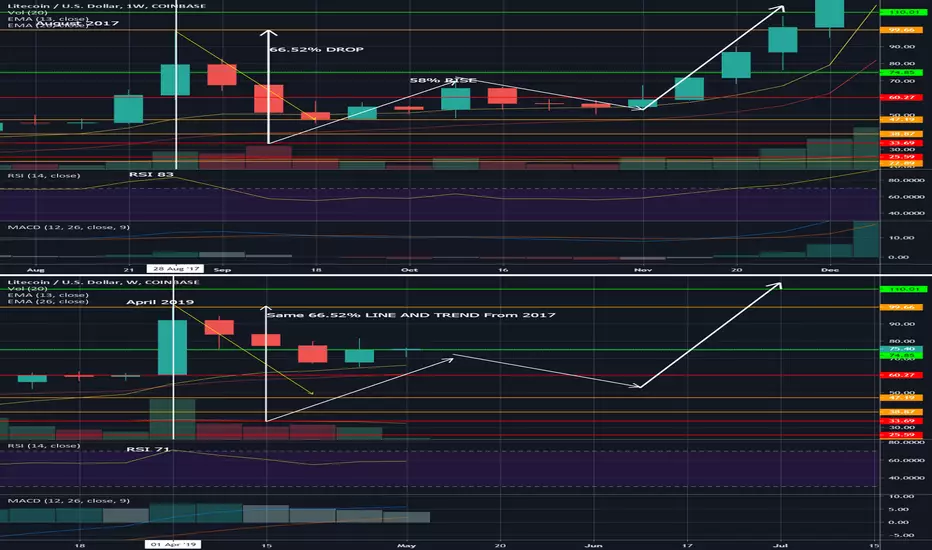
This chart leans me bullish simply because of the correlation. We cannot deny the correlation between August 2017 price action and April 2019. We have our initial spike then three weeks of pull back. Then 1 week green. If this continues, we should have a slightly red week this week followed by a nice green week next week. We have a 57 RSI which is IDENTICAL to 2017 again. This chart has me pretty excited because if history continues to follow then we are in for a massive run starting in 6 WEEKS. That is the one you do not want to miss or be short on. I see us testing back down to the 12EMA at about 66.50 and then bouncing back up close to our current level this week.

免責事項
これらの情報および投稿は、TradingViewが提供または承認する金融、投資、取引、またはその他の種類の助言もしくは推奨であることを意図したものではなく、またこれらに該当するものでもありません。詳細は利用規約をご覧ください。
免責事項
これらの情報および投稿は、TradingViewが提供または承認する金融、投資、取引、またはその他の種類の助言もしくは推奨であることを意図したものではなく、またこれらに該当するものでもありません。詳細は利用規約をご覧ください。