
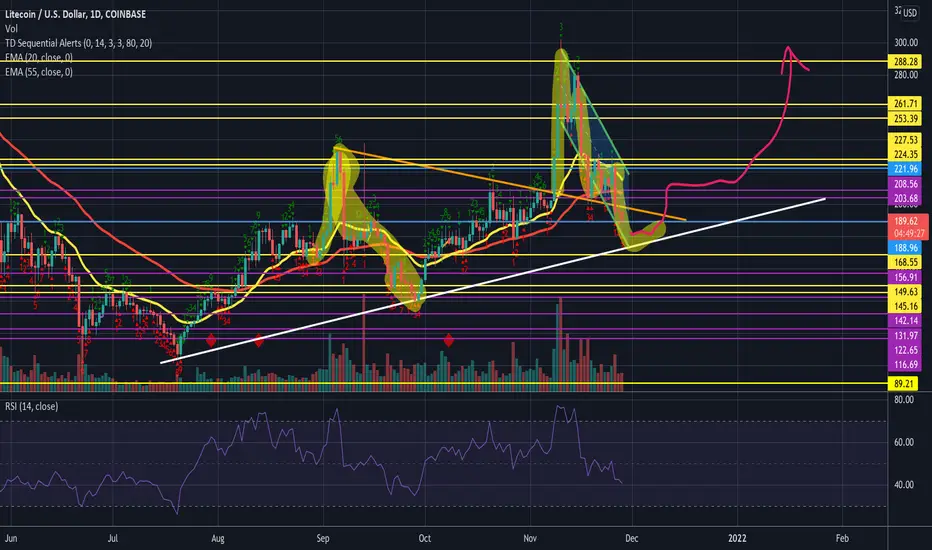
The chart pattern is almost identical on the daily as it was back in September. Forming a nice fractal pattern as you can see all the way down the very similar RSI movement.
I drew where I believe we're headed over the next few weeks provided we keep the white line which has been trend support ever since we bottomed out in July.
Let me know what you see?
I drew where I believe we're headed over the next few weeks provided we keep the white line which has been trend support ever since we bottomed out in July.
Let me know what you see?

免責事項
これらの情報および投稿は、TradingViewが提供または承認する金融、投資、取引、またはその他の種類の助言もしくは推奨であることを意図したものではなく、またこれらに該当するものでもありません。詳細は利用規約をご覧ください。
免責事項
これらの情報および投稿は、TradingViewが提供または承認する金融、投資、取引、またはその他の種類の助言もしくは推奨であることを意図したものではなく、またこれらに該当するものでもありません。詳細は利用規約をご覧ください。