
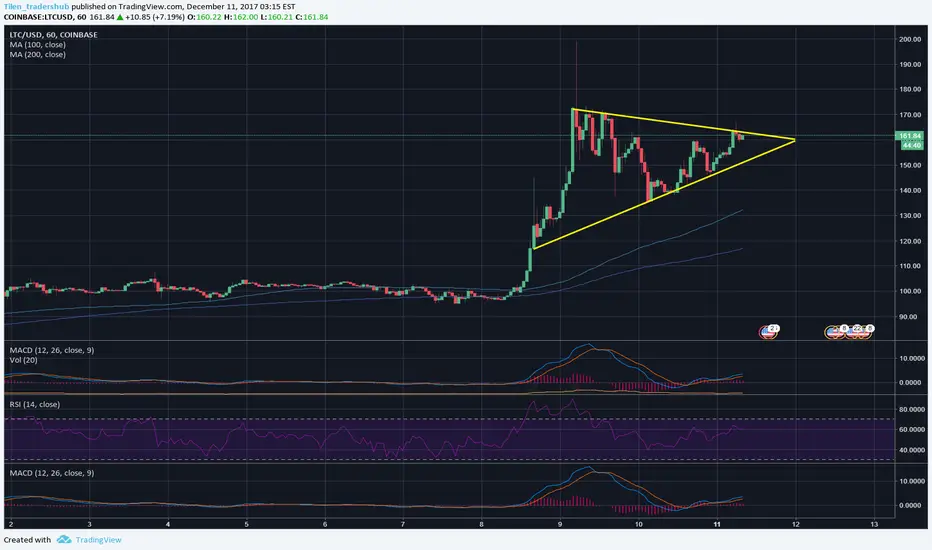
A symmetrical triangle is a chart formation where the slope of the price’s highs and the slope of the price’s lows converge together to a point where it looks like a triangle. During this formation the market is making lower highs and higher lows, neither the buyers nor the sellers are pushing the price far enough to make a clear trend. LTC is forming a bullish pattern and might clear the upper resistance and continue to grind higher. If we get a clean break, LTC could reach $200 very soon. SL should be placed just under the support. RSI & MACD both in bullish mode, which is strong sign that buyers are in control.

免責事項
これらの情報および投稿は、TradingViewが提供または承認する金融、投資、取引、またはその他の種類の助言もしくは推奨であることを意図したものではなく、またこれらに該当するものでもありません。詳細は利用規約をご覧ください。
免責事項
これらの情報および投稿は、TradingViewが提供または承認する金融、投資、取引、またはその他の種類の助言もしくは推奨であることを意図したものではなく、またこれらに該当するものでもありません。詳細は利用規約をご覧ください。