
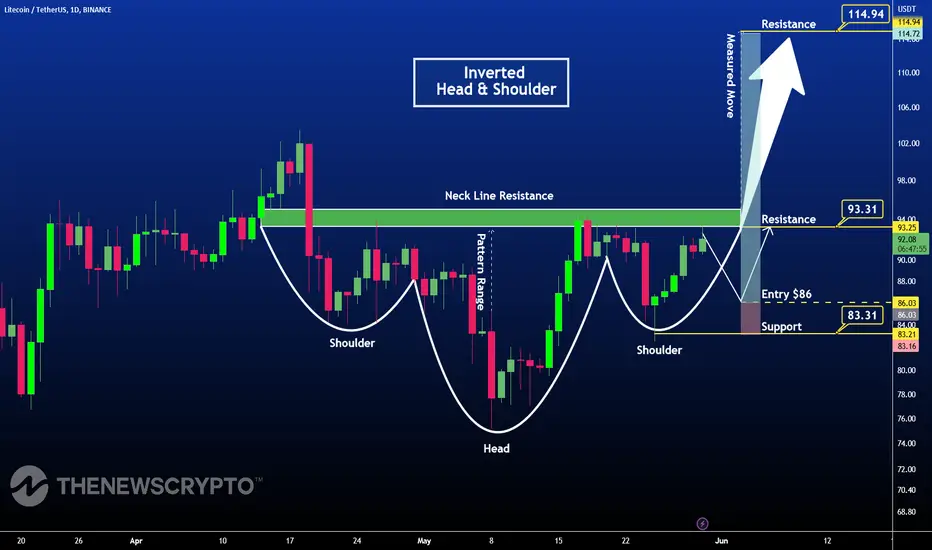
Litecoin (LTC) ranks 12th on CoinMarketCap in terms of its market capitalization. The overview of the Litecoin Price prediction for 2023 is explained below with a daily time frame.
In the above chart, Litecoin (LTC) laid out an ascending triangle pattern. It is the inverse of the head and shoulder pattern. Generally, in this pattern, the price action slides downwards and then rises up. Thus, forming three troughs in the pattern, left shoulder, head, and right shoulder.
This pattern can be a potential signal for the upcoming bullish market. If the price action establishes a breakout above the neckline resistance, the price might rise up to new highs.At the time of analysis, the price of Litecoin (LTC) was recorded at $91.99. If the pattern trend continues, the price of LTC might reach the resistance levels of $93.31 and $11. If the trend reverses, then the price of LTC may fall to the support of $83.31
In the above chart, Litecoin (LTC) laid out an ascending triangle pattern. It is the inverse of the head and shoulder pattern. Generally, in this pattern, the price action slides downwards and then rises up. Thus, forming three troughs in the pattern, left shoulder, head, and right shoulder.
This pattern can be a potential signal for the upcoming bullish market. If the price action establishes a breakout above the neckline resistance, the price might rise up to new highs.At the time of analysis, the price of Litecoin (LTC) was recorded at $91.99. If the pattern trend continues, the price of LTC might reach the resistance levels of $93.31 and $11. If the trend reverses, then the price of LTC may fall to the support of $83.31
トレード稼働中
トレード稼働中
トレード稼働中

関連の投稿
免責事項
これらの情報および投稿は、TradingViewが提供または承認する金融、投資、取引、またはその他の種類の助言もしくは推奨であることを意図したものではなく、またこれらに該当するものでもありません。詳細は利用規約をご覧ください。
関連の投稿
免責事項
これらの情報および投稿は、TradingViewが提供または承認する金融、投資、取引、またはその他の種類の助言もしくは推奨であることを意図したものではなく、またこれらに該当するものでもありません。詳細は利用規約をご覧ください。