
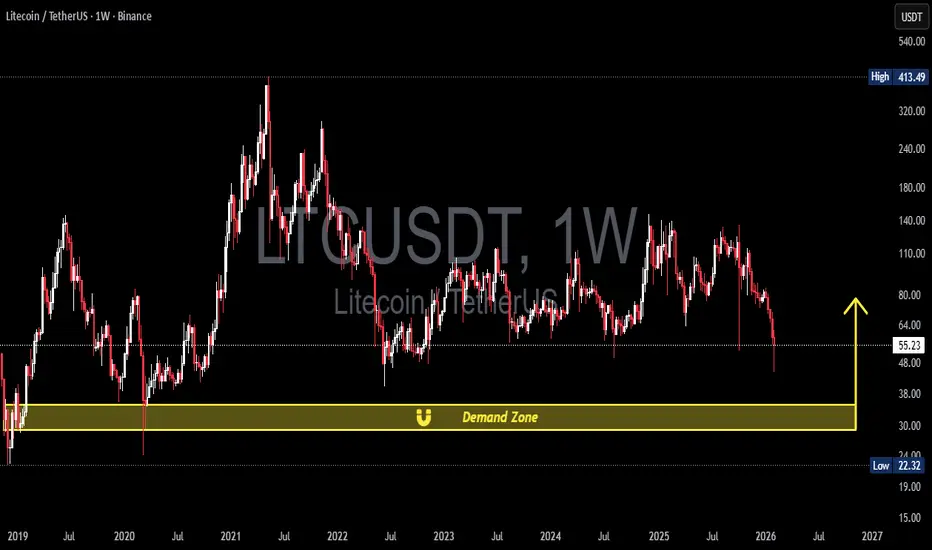
Structure & Pattern Formation
1. Macro Sideways Range
Since 2022, LTC has been moving within a broad range:
Resistance range: $110 – $140
Mid support: $60 – $70
Extreme demand: $35 – $29
This structure reflects a long accumulation / re-accumulation phase after the bear market.
---
2. Lower High Formation
From 2023 → 2025 we can observe:
Repeated lower highs
Buyers failing to break the $140 resistance
Indicating selling pressure remains dominant
This is characteristic of distribution / weakening bullish structure.
---
3. Deviation & Liquidity Sweep
Recent candles show:
A sharp breakdown from $60 support
Small rejection wicks
Signs of a liquidity grab toward lower demand
This often occurs before either a reversal or further breakdown.
---
Key Levels
Resistance:
$80
$110
$140
Support:
$55 (minor)
$35 – $29 (Major Demand Zone) ← yellow zone
Extreme Low:
$22 (historical wick low)
---
Bullish Scenario
The bullish case activates if:
1. Price enters the $35 – $29 demand zone
2. Strong reaction appears (bullish engulfing / long wicks)
3. Volume increases
Potential upside targets:
Initial bounce → $55
Break above $55 → $80
Strong momentum → $110
In a macro context, this zone could form a cycle bottom for Litecoin.
---
Bearish Scenario
The bearish scenario unfolds if:
1. $35 – $29 demand breaks cleanly
2. Weekly close below $29
3. No significant buyer reaction
Downside targets:
$25
$22 (historical low)
Possible deviation below before recovery
A break of this zone would signal late-stage bear market capitulation.
---
Conclusion
LTC is approaching a critical macro demand zone
The $35 – $29 area will determine reversal vs continuation
Price reaction here will shape LTC’s direction for the coming months
Best macro risk/reward typically appears at extreme demand levels
As long as the zone holds → macro accumulation opportunity remains
If it breaks → potential final capitulation leg
#LTC #Litecoin #LTCUSDT #CryptoAnalysis #TechnicalAnalysis #Altcoins #CryptoTrading #SupportResistance #DemandZone #MarketStructure #CryptoMarket #SwingTrading #LongTermAnalysis #BearMarket #BullishReversal
1. Macro Sideways Range
Since 2022, LTC has been moving within a broad range:
Resistance range: $110 – $140
Mid support: $60 – $70
Extreme demand: $35 – $29
This structure reflects a long accumulation / re-accumulation phase after the bear market.
---
2. Lower High Formation
From 2023 → 2025 we can observe:
Repeated lower highs
Buyers failing to break the $140 resistance
Indicating selling pressure remains dominant
This is characteristic of distribution / weakening bullish structure.
---
3. Deviation & Liquidity Sweep
Recent candles show:
A sharp breakdown from $60 support
Small rejection wicks
Signs of a liquidity grab toward lower demand
This often occurs before either a reversal or further breakdown.
---
Key Levels
Resistance:
$80
$110
$140
Support:
$55 (minor)
$35 – $29 (Major Demand Zone) ← yellow zone
Extreme Low:
$22 (historical wick low)
---
Bullish Scenario
The bullish case activates if:
1. Price enters the $35 – $29 demand zone
2. Strong reaction appears (bullish engulfing / long wicks)
3. Volume increases
Potential upside targets:
Initial bounce → $55
Break above $55 → $80
Strong momentum → $110
In a macro context, this zone could form a cycle bottom for Litecoin.
---
Bearish Scenario
The bearish scenario unfolds if:
1. $35 – $29 demand breaks cleanly
2. Weekly close below $29
3. No significant buyer reaction
Downside targets:
$25
$22 (historical low)
Possible deviation below before recovery
A break of this zone would signal late-stage bear market capitulation.
---
Conclusion
LTC is approaching a critical macro demand zone
The $35 – $29 area will determine reversal vs continuation
Price reaction here will shape LTC’s direction for the coming months
Best macro risk/reward typically appears at extreme demand levels
As long as the zone holds → macro accumulation opportunity remains
If it breaks → potential final capitulation leg
#LTC #Litecoin #LTCUSDT #CryptoAnalysis #TechnicalAnalysis #Altcoins #CryptoTrading #SupportResistance #DemandZone #MarketStructure #CryptoMarket #SwingTrading #LongTermAnalysis #BearMarket #BullishReversal

✅ Get Free Signals! Join Our Telegram Channel Here: t.me/TheCryptoNuclear
✅ Twitter: twitter.com/crypto_nuclear
✅ Join Bybit : partner.bybit.com/b/nuclearvip
✅ Benefits : Lifetime Trading Fee Discount -50%
✅ Twitter: twitter.com/crypto_nuclear
✅ Join Bybit : partner.bybit.com/b/nuclearvip
✅ Benefits : Lifetime Trading Fee Discount -50%
免責事項
これらの情報および投稿は、TradingViewが提供または承認する金融、投資、取引、またはその他の種類の助言もしくは推奨であることを意図したものではなく、またこれらに該当するものでもありません。詳細は利用規約をご覧ください。
✅ Get Free Signals! Join Our Telegram Channel Here: t.me/TheCryptoNuclear
✅ Twitter: twitter.com/crypto_nuclear
✅ Join Bybit : partner.bybit.com/b/nuclearvip
✅ Benefits : Lifetime Trading Fee Discount -50%
✅ Twitter: twitter.com/crypto_nuclear
✅ Join Bybit : partner.bybit.com/b/nuclearvip
✅ Benefits : Lifetime Trading Fee Discount -50%
免責事項
これらの情報および投稿は、TradingViewが提供または承認する金融、投資、取引、またはその他の種類の助言もしくは推奨であることを意図したものではなく、またこれらに該当するものでもありません。詳細は利用規約をご覧ください。