
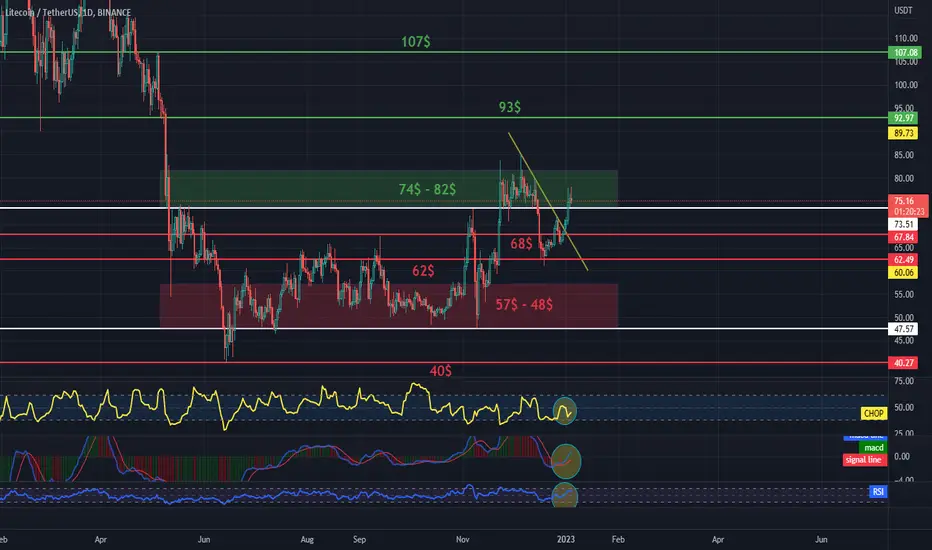
I invite you to review the LTC to USDT chart on a one-day timeframe. We will start by marking the sideways trend channel and then we can mark the local downtrend line.
Now, with the help of Fib Retracement, we will check the resistance places for the price, and here we see that we first have a strong resistance zone from $74 to $82, when we manage to break it and test it positively, we have another resistance at $93 and $107.
Looking the other way, we can mark the support areas, as you can see we have the first support at $68, the second at $62, then we can mark a strong support zone from $57 to $48, however, if it is broken and the price drops below the lower limit of the channel, we have another support at $40, which is my last low.
As we can see on the CHOP index, the energy has been used for the last move, the MACD confirms the downtrend, while the RSI touched the upper range, which means that we can expect a price correction.
Now, with the help of Fib Retracement, we will check the resistance places for the price, and here we see that we first have a strong resistance zone from $74 to $82, when we manage to break it and test it positively, we have another resistance at $93 and $107.
Looking the other way, we can mark the support areas, as you can see we have the first support at $68, the second at $62, then we can mark a strong support zone from $57 to $48, however, if it is broken and the price drops below the lower limit of the channel, we have another support at $40, which is my last low.
As we can see on the CHOP index, the energy has been used for the last move, the MACD confirms the downtrend, while the RSI touched the upper range, which means that we can expect a price correction.

免責事項
これらの情報および投稿は、TradingViewが提供または承認する金融、投資、取引、またはその他の種類の助言もしくは推奨であることを意図したものではなく、またこれらに該当するものでもありません。詳細は利用規約をご覧ください。
免責事項
これらの情報および投稿は、TradingViewが提供または承認する金融、投資、取引、またはその他の種類の助言もしくは推奨であることを意図したものではなく、またこれらに該当するものでもありません。詳細は利用規約をご覧ください。