
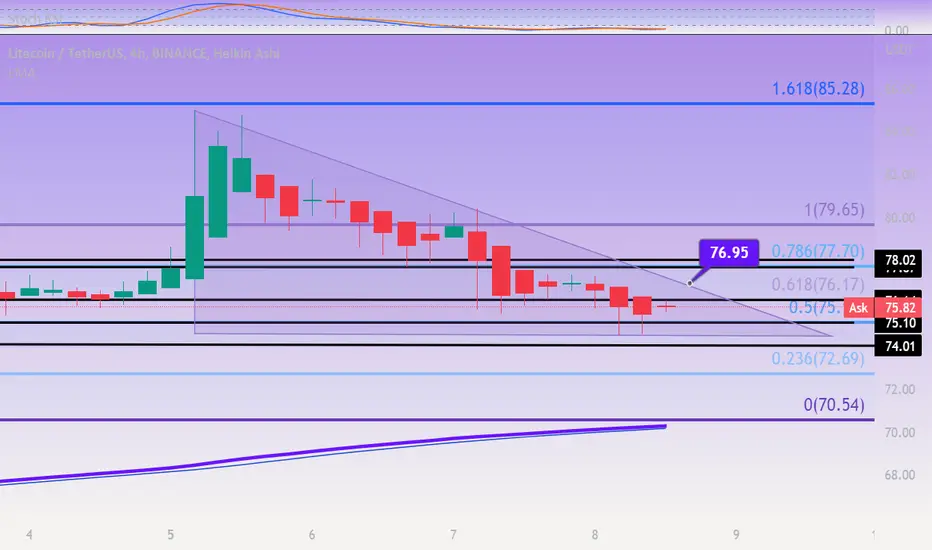
LTC formed a perfect accumulation triangle and, breaking the upper edge of this one which is at 76.95, LTCUSDT explodes upwards, seeking 85.05. Before you have to go through the resistances of 77.8 / 79.57.
RSI flat on the chart, indicating oversold and reinforcing the upside triangle breakout.
In case there is a reversal of this trend, I would look for its supports at 75.10 / 74.01 / 72.75.
Suports: 75.10 / 74.01 / 72.75.
Resistances: 77.8 / 79.57.
RSI flat on the chart, indicating oversold and reinforcing the upside triangle breakout.
In case there is a reversal of this trend, I would look for its supports at 75.10 / 74.01 / 72.75.
Suports: 75.10 / 74.01 / 72.75.
Resistances: 77.8 / 79.57.

Renato Ulianov | Market Analysis & Trading
YouTube: youtube.com/@TradewithRenatoUlianov
Disclaimer: All content is for educational and informational purposes only and does not constitute financial advice.
YouTube: youtube.com/@TradewithRenatoUlianov
Disclaimer: All content is for educational and informational purposes only and does not constitute financial advice.
免責事項
これらの情報および投稿は、TradingViewが提供または承認する金融、投資、取引、またはその他の種類の助言もしくは推奨であることを意図したものではなく、またこれらに該当するものでもありません。詳細は利用規約をご覧ください。