
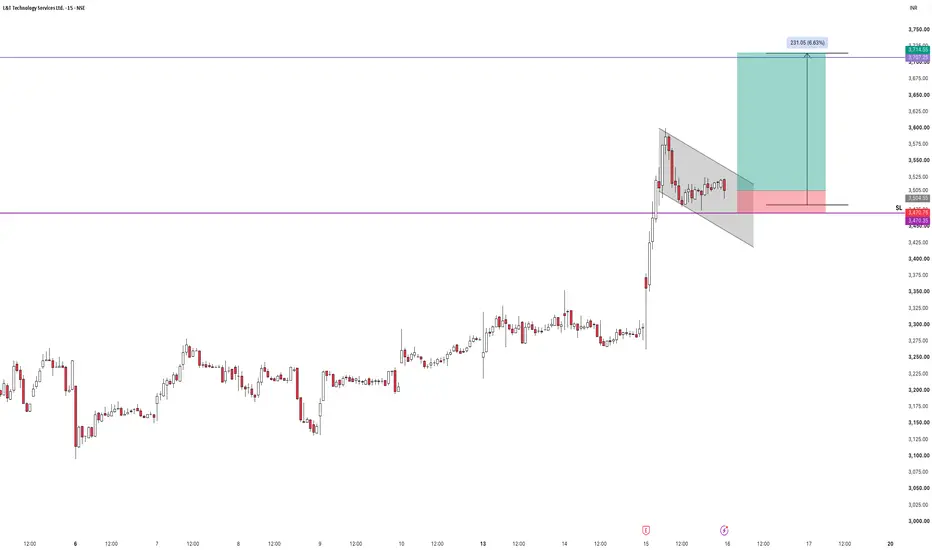
L&T Technology Services (LTTS) | Bull Flag on 15-Min Chart | Short-Term Momentum Setup
After a strong impulsive rally, LTTS is taking a healthy pause inside a Bull Flag (falling channel). Instead of giving back gains aggressively, the stock is consolidating near the highs, which is generally a sign of strength.
The current structure suggests that buyers are absorbing supply, and a breakout above the flag could trigger the next leg of the uptrend.
Why I’m Bullish
* Strong momentum move followed by controlled consolidation.
* Price continues to hold above immediate support around ₹3,500.
* The falling channel represents a classic bullish continuation pattern.
* Risk-to-reward remains favorable as long as the lower boundary of the flag holds.
Levels to Watch
📈 Entry: Above ₹3,520 (15-minute closing basis)
🛑 Stop Loss: ₹3,470
🎯 Target 1: ₹3,580
🎯 Target 2: ₹3,640
🎯 Target 3: ₹3,705–3,715
Trading Plan
A decisive breakout with increased volume would confirm the continuation pattern. Until then, patience is key. Avoid anticipating the breakout—let the market confirm the move.
If the stock closes below ₹3,470, the setup becomes invalid and it’s better to wait for a fresh structure.
⸻
Chart Summary
Entry: Above ₹3,520
Stop Loss: ₹3,470
Target 1: ₹3,580
Target 2: ₹3,640
Target 3: ₹3,705–3,715
⸻
Disclaimer: This analysis is purely based on price action and chart structure. It is shared for educational purposes only and should not be considered investment or trading advice. Always manage your risk and position size.
⸻
If you like to see more posts, please do show appreciation by liking this post and following me on:
in.tradingview.com/u/lovishkhanduja/
After a strong impulsive rally, LTTS is taking a healthy pause inside a Bull Flag (falling channel). Instead of giving back gains aggressively, the stock is consolidating near the highs, which is generally a sign of strength.
The current structure suggests that buyers are absorbing supply, and a breakout above the flag could trigger the next leg of the uptrend.
Why I’m Bullish
* Strong momentum move followed by controlled consolidation.
* Price continues to hold above immediate support around ₹3,500.
* The falling channel represents a classic bullish continuation pattern.
* Risk-to-reward remains favorable as long as the lower boundary of the flag holds.
Levels to Watch
📈 Entry: Above ₹3,520 (15-minute closing basis)
🛑 Stop Loss: ₹3,470
🎯 Target 1: ₹3,580
🎯 Target 2: ₹3,640
🎯 Target 3: ₹3,705–3,715
Trading Plan
A decisive breakout with increased volume would confirm the continuation pattern. Until then, patience is key. Avoid anticipating the breakout—let the market confirm the move.
If the stock closes below ₹3,470, the setup becomes invalid and it’s better to wait for a fresh structure.
⸻
Chart Summary
Entry: Above ₹3,520
Stop Loss: ₹3,470
Target 1: ₹3,580
Target 2: ₹3,640
Target 3: ₹3,705–3,715
⸻
Disclaimer: This analysis is purely based on price action and chart structure. It is shared for educational purposes only and should not be considered investment or trading advice. Always manage your risk and position size.
⸻
If you like to see more posts, please do show appreciation by liking this post and following me on:
in.tradingview.com/u/lovishkhanduja/

免責事項
これらの情報および投稿は、TradingViewが提供または承認する金融、投資、取引、またはその他の種類の助言もしくは推奨であることを意図したものではなく、またこれらに該当するものでもありません。詳細は利用規約をご覧ください。
免責事項
これらの情報および投稿は、TradingViewが提供または承認する金融、投資、取引、またはその他の種類の助言もしくは推奨であることを意図したものではなく、またこれらに該当するものでもありません。詳細は利用規約をご覧ください。