ロング
H&S Formation
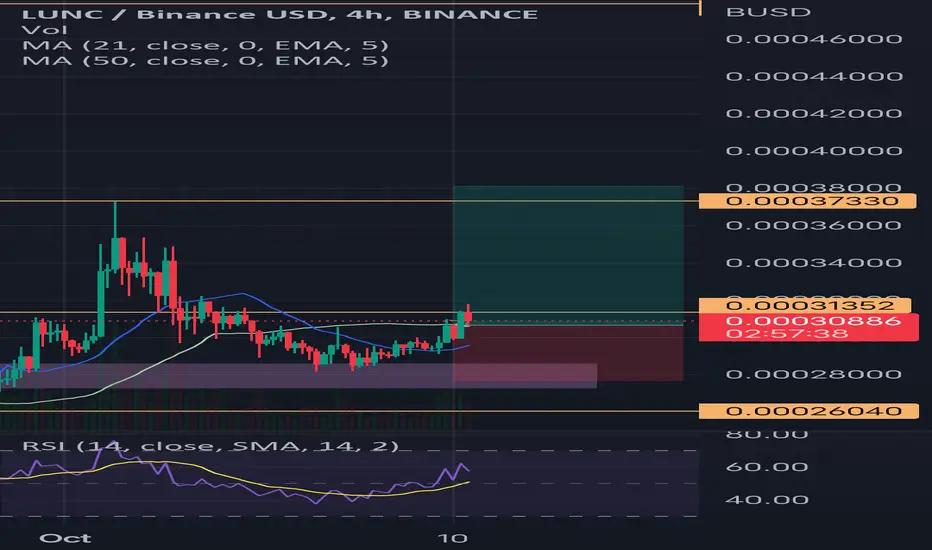
We see a H&S formation on the 4hr chart which is also depicted by the 21MA & 50MA.
We can expect a push into the yellow marked area .37333 with a high at .39.
We would need sustained buying above .30. a fall below .26 would bring into question downside pressure into .16
Let me know your thoughts
We can expect a push into the yellow marked area .37333 with a high at .39.
We would need sustained buying above .30. a fall below .26 would bring into question downside pressure into .16
Let me know your thoughts

免責事項
これらの情報および投稿は、TradingViewが提供または承認する金融、投資、取引、またはその他の種類の助言もしくは推奨であることを意図したものではなく、またこれらに該当するものでもありません。詳細は利用規約をご覧ください。
免責事項
これらの情報および投稿は、TradingViewが提供または承認する金融、投資、取引、またはその他の種類の助言もしくは推奨であることを意図したものではなく、またこれらに該当するものでもありません。詳細は利用規約をご覧ください。