
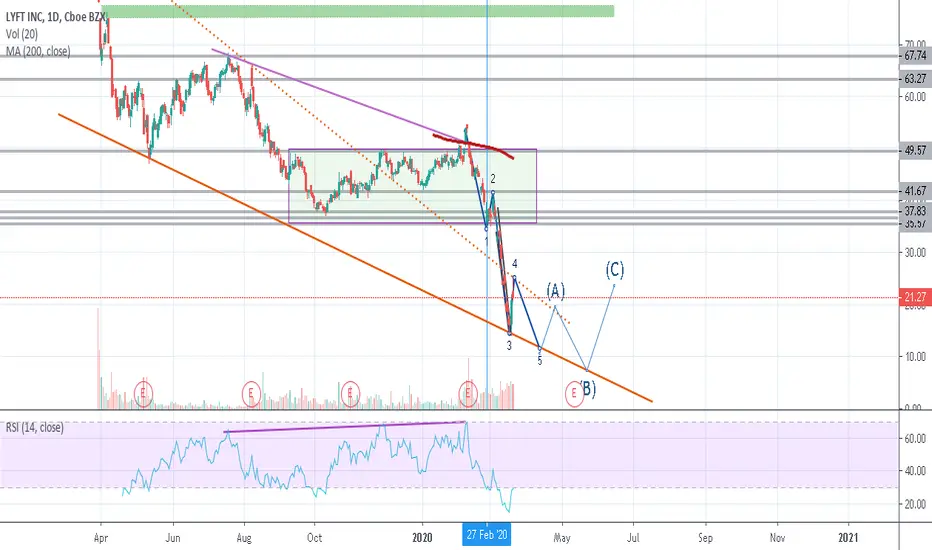
We can see in 1 day chart of Lyft stock the forming of an elliot wave in the downtrent direction and the possible areas of the ABC corrective pattern.
The downtrend was also confirmed by the hidden divergence we can see in the chart with purple lines.
The downtrend was also confirmed by the hidden divergence we can see in the chart with purple lines.

免責事項
これらの情報および投稿は、TradingViewが提供または承認する金融、投資、取引、またはその他の種類の助言もしくは推奨であることを意図したものではなく、またこれらに該当するものでもありません。詳細は利用規約をご覧ください。
免責事項
これらの情報および投稿は、TradingViewが提供または承認する金融、投資、取引、またはその他の種類の助言もしくは推奨であることを意図したものではなく、またこれらに該当するものでもありません。詳細は利用規約をご覧ください。