
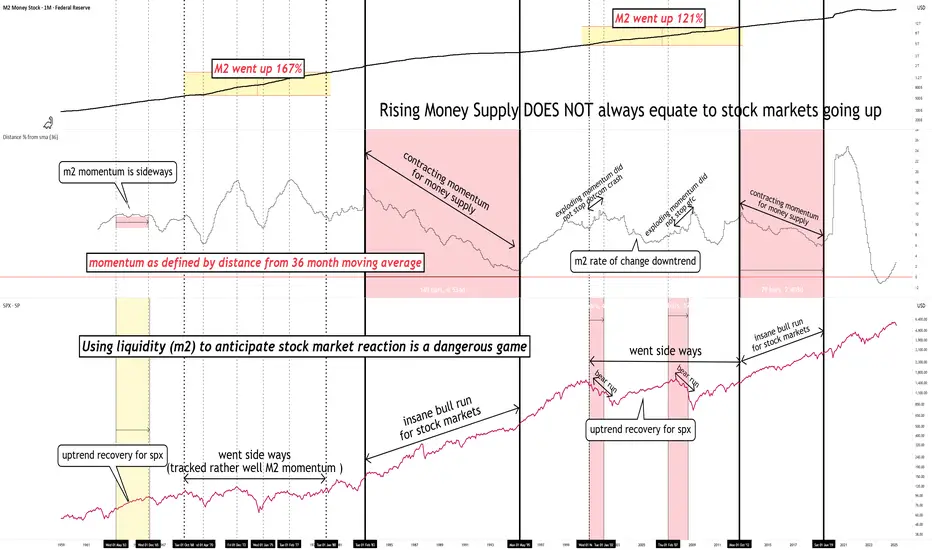
History has shown us that using liquidity (m2) to anticipate stock market reaction is a dangerous game.
It can work, until it doesn't.
What always works is analyzing the price chart based on its own merits.
It can work, until it doesn't.
What always works is analyzing the price chart based on its own merits.

✅Industry-leading technical analysis
✅Market commentary
✅Trade Tracker
✅Podcast Reviews
Use discount code "TRADINGVIEW" and get a lifetime 50% discount on PREMIUM plans
🔗northstarbadcharts.com/
✅Market commentary
✅Trade Tracker
✅Podcast Reviews
Use discount code "TRADINGVIEW" and get a lifetime 50% discount on PREMIUM plans
🔗northstarbadcharts.com/
免責事項
これらの情報および投稿は、TradingViewが提供または承認する金融、投資、取引、またはその他の種類の助言もしくは推奨であることを意図したものではなく、またこれらに該当するものでもありません。詳細は利用規約をご覧ください。