
📌 MATA.V | Long Setup | Capitulation-to-Reversal in Bitcoin–RWA Microcap | Sep 11, 2025
🔹 Thesis Summary
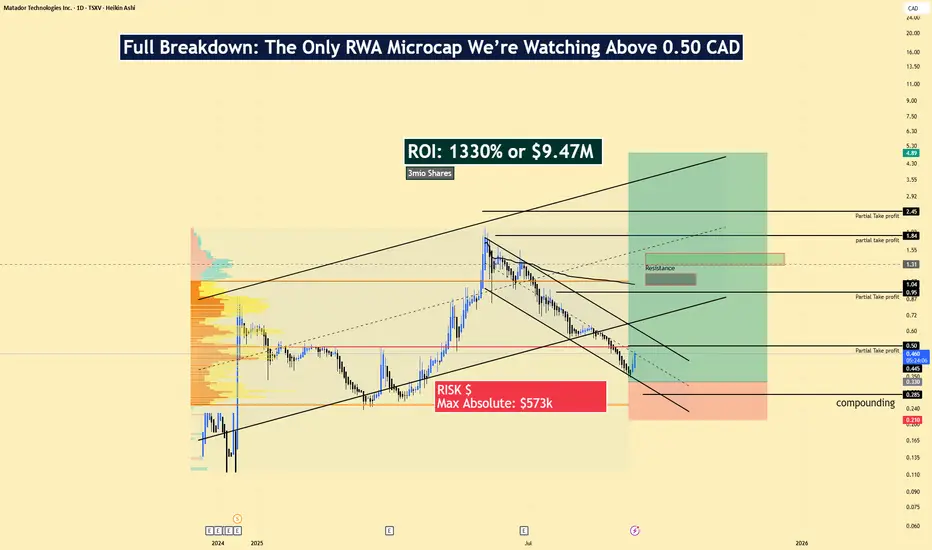
Post-capitulation base within a descending channel is testing a high-volume shelf (~0.44–0.50 CAD). A reclaim/hold above this node plus a channel break unlocks fast air pockets toward 0.95/1.04 and 1.84. Thin float and a BTC-treasury narrative provide torque; invalidation is clean.
🔹Trade Setup
Bias: Long
Entry Zone: ~0.33 CAD (VPVR shelf / channel retest)
Stop Loss: 0.21 CAD (close below prior swing/volume shelf)
Take-Profits:
TP1: 0.55 (prior pivot / labeled partial TP)
TP2: 0.95–1.04 (supply box / breakdown origin)
TP3: 1.84 (mid-range objective)
Max Target: 2.65–2.67 (range high); stretch: 5.55 if momentum regime returns
R:R guide (from ~0.47): to 1.84 ≈ 5:1; to 2.65 ≈ 8:1; to 5.55 ≈ 19:1
🔹Narrative & Context
Structure: Multi-month falling channel following a sharp advance; first impulsive bounce off 0.33–0.35 with demand clustering on the 0.44–0.50 shelf. Clear LVNs above 0.55 suggest gap-like travel into 0.95/1.04 on sustained bids. Marked supply (1.18–1.31) is the next decision zone; acceptance there opens 1.84.
Flow/Liquidity: Float ≈ 17.86M; thin supply can amplify moves once price clears overhead supply. “3mio shares” overhang shown on the chart looks digested.
🔹Sector/Narrative: Bitcoin-native/RWA positioning (treasury BTC + tokenized metals) ties equity performance to BTC trend and tokenization flows. If BTC is stable/up and L2/RWA headlines cycle in, microcaps on TSXV tend to re-rate quickly.
🔹Valuation & Context (Pro Metrics, Framed Simply)
Revenue = 0 → vs. sector financials where revenue is positive → pre-revenue optionality story → price driven by treasury value, product progress, and capital access rather than cash generation.
Net Income (FY) = −CAD 4.49M → vs. profitable peers → loss-making, cash burn sensitivity → reinforces the need for tight invalidation.
Quality — ROE: Negative → vs. positive quality screens → capital not yet earning → rallies more dependent on narrative/treasury than fundamentals near-term.
Risk — 1Y Beta: −5.75 (unstable reading) → vs. ~1.0 market beta → expect outsized, non-linear moves → position sizing and staggered TPs matter.
(Market cap provided ≈ CAD 27.66M; no P/E or P/FCF available due to negatives/early stage.)
🔹Contrarian Angle (Your Edge)
Consensus dismisses MATA as too small, pre-revenue, and crypto-tied. The chart shows accumulation at a clean invalidation with multiple fast-travel zones above. If BTC holds bid and the product/treasury narrative advances, the equity can overshoot conservative models—our path maps 0.95 → 1.84 → 2.65 with a momentum extension possible toward 5.55.
🔹Risks
Capital needs / dilution if burn persists or treasury expansion is financed via equity.
BTC drawdown or crypto risk-off (kills the torque).
Regulatory or product-execution slippage in tokenized metals/RWAs.
Macro Considerations
BTC/ETH structure: Maintain longs only while BTC is above its own weekly higher-low and funding is orderly; fade if BTC loses weekly trend.
Flows/vol: TSXV microcap risk appetite, CAD liquidity conditions, and USD/DXY impulses can accelerate or cap breakouts.
Event path: Any treasury updates (BTC adds/sales), app adoption metrics, or financing announcements will likely be gap catalysts.
🔹Bottom Line
MATA is high-beta, pre-revenue, and narrative-driven but the technicals offer defined risk with asymmetric upside. Treat it like a setup, not a balance-sheet long: respect the 0.21 invalidation, scale into strength through 0.55/1.04, reassess at 1.84, and trail for a potential range-high run.
🔹Forward Path
If this post gains traction (10+ likes), I’ll share:
A weekly/H4 alignment map with trigger conditions above 0.55 and 1.04
Updated levels if supply at 1.18–1.31 rejects or accepts
Q&A in comments on sizing, scaling, and alternative invalidations
Like & Follow for structured ideas, not signals. I post high-conviction setups here before broader narratives play out.
⚠️ Disclaimer: Not financial advice. Do your own research. Chart elements may include AI-assisted enhancements.
🔹 Footnote
Forward P/E: Price divided by expected earnings over the next 12 months. Lower = cheaper relative to profits.
P/FCF (Price-to-Free-Cash-Flow): Price vs. the cash left after investments. A measure of efficiency.
FCF Yield: Free cash flow per share ÷ price per share. Higher = more cash returned for each dollar invested.
ROE (Return on Equity): Net income ÷ shareholder equity. Shows management efficiency with investor capital.
ROIC (Return on Invested Capital): Net income ÷ all invested capital (equity + debt). A purer profitability gauge.
Debt/Equity: Debt divided by equity. <1 usually means balance sheet is conservative.
R:R (Risk-to-Reward): Ratio of expected upside vs. downside. 3:1 = you risk $1 to make $3.
🔹 Thesis Summary
Post-capitulation base within a descending channel is testing a high-volume shelf (~0.44–0.50 CAD). A reclaim/hold above this node plus a channel break unlocks fast air pockets toward 0.95/1.04 and 1.84. Thin float and a BTC-treasury narrative provide torque; invalidation is clean.
🔹Trade Setup
Bias: Long
Entry Zone: ~0.33 CAD (VPVR shelf / channel retest)
Stop Loss: 0.21 CAD (close below prior swing/volume shelf)
Take-Profits:
TP1: 0.55 (prior pivot / labeled partial TP)
TP2: 0.95–1.04 (supply box / breakdown origin)
TP3: 1.84 (mid-range objective)
Max Target: 2.65–2.67 (range high); stretch: 5.55 if momentum regime returns
R:R guide (from ~0.47): to 1.84 ≈ 5:1; to 2.65 ≈ 8:1; to 5.55 ≈ 19:1
🔹Narrative & Context
Structure: Multi-month falling channel following a sharp advance; first impulsive bounce off 0.33–0.35 with demand clustering on the 0.44–0.50 shelf. Clear LVNs above 0.55 suggest gap-like travel into 0.95/1.04 on sustained bids. Marked supply (1.18–1.31) is the next decision zone; acceptance there opens 1.84.
Flow/Liquidity: Float ≈ 17.86M; thin supply can amplify moves once price clears overhead supply. “3mio shares” overhang shown on the chart looks digested.
🔹Sector/Narrative: Bitcoin-native/RWA positioning (treasury BTC + tokenized metals) ties equity performance to BTC trend and tokenization flows. If BTC is stable/up and L2/RWA headlines cycle in, microcaps on TSXV tend to re-rate quickly.
🔹Valuation & Context (Pro Metrics, Framed Simply)
Revenue = 0 → vs. sector financials where revenue is positive → pre-revenue optionality story → price driven by treasury value, product progress, and capital access rather than cash generation.
Net Income (FY) = −CAD 4.49M → vs. profitable peers → loss-making, cash burn sensitivity → reinforces the need for tight invalidation.
Quality — ROE: Negative → vs. positive quality screens → capital not yet earning → rallies more dependent on narrative/treasury than fundamentals near-term.
Risk — 1Y Beta: −5.75 (unstable reading) → vs. ~1.0 market beta → expect outsized, non-linear moves → position sizing and staggered TPs matter.
(Market cap provided ≈ CAD 27.66M; no P/E or P/FCF available due to negatives/early stage.)
🔹Contrarian Angle (Your Edge)
Consensus dismisses MATA as too small, pre-revenue, and crypto-tied. The chart shows accumulation at a clean invalidation with multiple fast-travel zones above. If BTC holds bid and the product/treasury narrative advances, the equity can overshoot conservative models—our path maps 0.95 → 1.84 → 2.65 with a momentum extension possible toward 5.55.
🔹Risks
Capital needs / dilution if burn persists or treasury expansion is financed via equity.
BTC drawdown or crypto risk-off (kills the torque).
Regulatory or product-execution slippage in tokenized metals/RWAs.
Macro Considerations
BTC/ETH structure: Maintain longs only while BTC is above its own weekly higher-low and funding is orderly; fade if BTC loses weekly trend.
Flows/vol: TSXV microcap risk appetite, CAD liquidity conditions, and USD/DXY impulses can accelerate or cap breakouts.
Event path: Any treasury updates (BTC adds/sales), app adoption metrics, or financing announcements will likely be gap catalysts.
🔹Bottom Line
MATA is high-beta, pre-revenue, and narrative-driven but the technicals offer defined risk with asymmetric upside. Treat it like a setup, not a balance-sheet long: respect the 0.21 invalidation, scale into strength through 0.55/1.04, reassess at 1.84, and trail for a potential range-high run.
🔹Forward Path
If this post gains traction (10+ likes), I’ll share:
A weekly/H4 alignment map with trigger conditions above 0.55 and 1.04
Updated levels if supply at 1.18–1.31 rejects or accepts
Q&A in comments on sizing, scaling, and alternative invalidations
Like & Follow for structured ideas, not signals. I post high-conviction setups here before broader narratives play out.
⚠️ Disclaimer: Not financial advice. Do your own research. Chart elements may include AI-assisted enhancements.
🔹 Footnote
Forward P/E: Price divided by expected earnings over the next 12 months. Lower = cheaper relative to profits.
P/FCF (Price-to-Free-Cash-Flow): Price vs. the cash left after investments. A measure of efficiency.
FCF Yield: Free cash flow per share ÷ price per share. Higher = more cash returned for each dollar invested.
ROE (Return on Equity): Net income ÷ shareholder equity. Shows management efficiency with investor capital.
ROIC (Return on Invested Capital): Net income ÷ all invested capital (equity + debt). A purer profitability gauge.
Debt/Equity: Debt divided by equity. <1 usually means balance sheet is conservative.
R:R (Risk-to-Reward): Ratio of expected upside vs. downside. 3:1 = you risk $1 to make $3.

Stop leaking money through bad sizing and messy execution.
I help busy professionals build a risk-controlled trading process.
Clear rules, templates, and review system.
Education only. Book: sentientinstitutes.com/diagnostic
I help busy professionals build a risk-controlled trading process.
Clear rules, templates, and review system.
Education only. Book: sentientinstitutes.com/diagnostic
関連の投稿
免責事項
これらの情報および投稿は、TradingViewが提供または承認する金融、投資、取引、またはその他の種類の助言もしくは推奨であることを意図したものではなく、またこれらに該当するものでもありません。詳細は利用規約をご覧ください。
Stop leaking money through bad sizing and messy execution.
I help busy professionals build a risk-controlled trading process.
Clear rules, templates, and review system.
Education only. Book: sentientinstitutes.com/diagnostic
I help busy professionals build a risk-controlled trading process.
Clear rules, templates, and review system.
Education only. Book: sentientinstitutes.com/diagnostic
関連の投稿
免責事項
これらの情報および投稿は、TradingViewが提供または承認する金融、投資、取引、またはその他の種類の助言もしくは推奨であることを意図したものではなく、またこれらに該当するものでもありません。詳細は利用規約をご覧ください。