MATICUSDT market structure
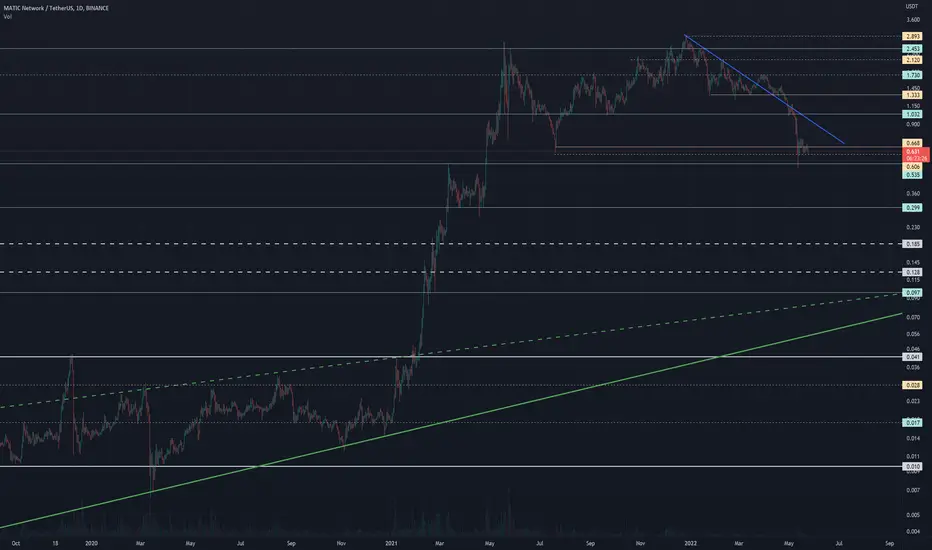
Strong levels represented by solid lines.
Less significant levels represented by dashed lines.
Trendlines represented by slanted lines.
More often than not, price action is choppy with much overlap between candles. Strictly following definitions for swing high/low could leave us with a market structure that is just unworkable. Our intent is simply to identify those key turning points which stand out on the chart as the most obvious levels, and therefore offer potential barriers to future price action.

免責事項
これらの情報および投稿は、TradingViewが提供または承認する金融、投資、取引、またはその他の種類の助言もしくは推奨であることを意図したものではなく、またこれらに該当するものでもありません。詳細は利用規約をご覧ください。
免責事項
これらの情報および投稿は、TradingViewが提供または承認する金融、投資、取引、またはその他の種類の助言もしくは推奨であることを意図したものではなく、またこれらに該当するものでもありません。詳細は利用規約をご覧ください。