ショート
MATIC Bearish Chart Pattern
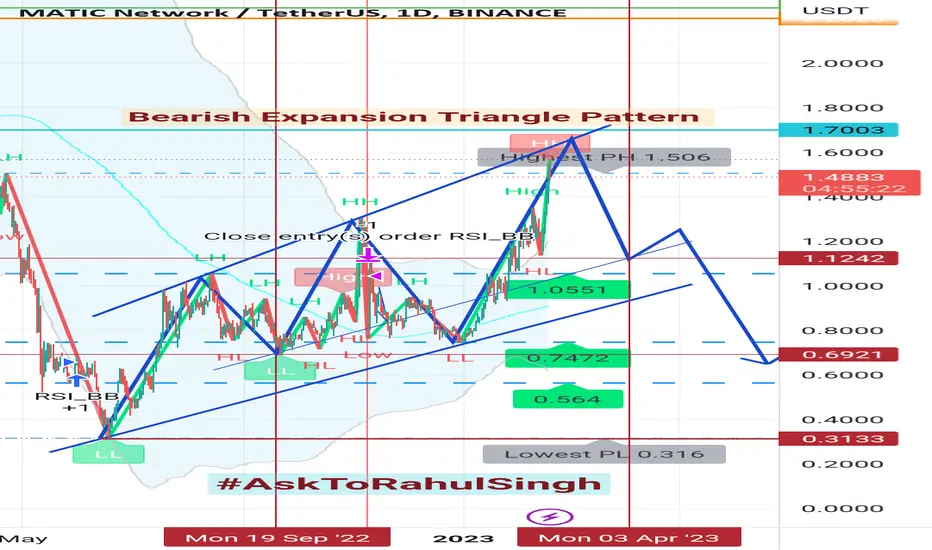
MATIC/USDT 1 DAY Chart
As per present #MATIC Technical Chart Analysis, based on Bearish Expansion Triangle Pattern, its 3rd final wave nearly completed today now and it's downside last wave will be starts. It's coming next target will be $1.13 and after next #BearishZone starts, next Lower-Low target is $0.69 upto April 2023.
As per present #MATIC Technical Chart Analysis, based on Bearish Expansion Triangle Pattern, its 3rd final wave nearly completed today now and it's downside last wave will be starts. It's coming next target will be $1.13 and after next #BearishZone starts, next Lower-Low target is $0.69 upto April 2023.

関連の投稿
免責事項
これらの情報および投稿は、TradingViewが提供または承認する金融、投資、取引、またはその他の種類の助言もしくは推奨であることを意図したものではなく、またこれらに該当するものでもありません。詳細は利用規約をご覧ください。
関連の投稿
免責事項
これらの情報および投稿は、TradingViewが提供または承認する金融、投資、取引、またはその他の種類の助言もしくは推奨であることを意図したものではなく、またこれらに該当するものでもありません。詳細は利用規約をご覧ください。