ロング
MATIC USDT
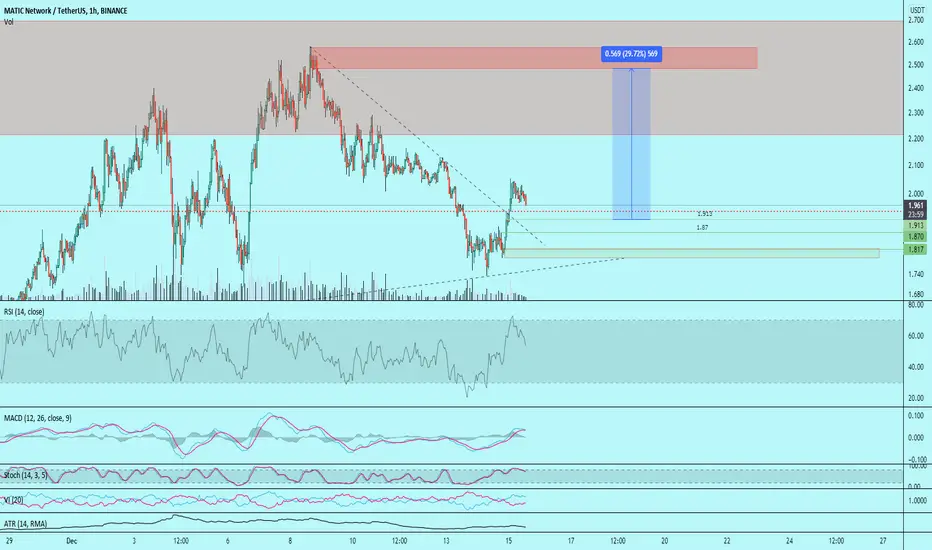
Simple play on Matic.
wait for signals at the green lines for potential bottom. dotted line daily close. this is also a potential support line.
Target is red zone in the red zone.
After that a small pullback. We have to see how thats gonna play out. The daily chart looks really good imo. One of the better charts ive looked into.
wait for signals at the green lines for potential bottom. dotted line daily close. this is also a potential support line.
Target is red zone in the red zone.
After that a small pullback. We have to see how thats gonna play out. The daily chart looks really good imo. One of the better charts ive looked into.

免責事項
これらの情報および投稿は、TradingViewが提供または承認する金融、投資、取引、またはその他の種類の助言もしくは推奨であることを意図したものではなく、またこれらに該当するものでもありません。詳細は利用規約をご覧ください。
免責事項
これらの情報および投稿は、TradingViewが提供または承認する金融、投資、取引、またはその他の種類の助言もしくは推奨であることを意図したものではなく、またこれらに該当するものでもありません。詳細は利用規約をご覧ください。