ロング
MATICUSDT 1D Fibonacci Analysis
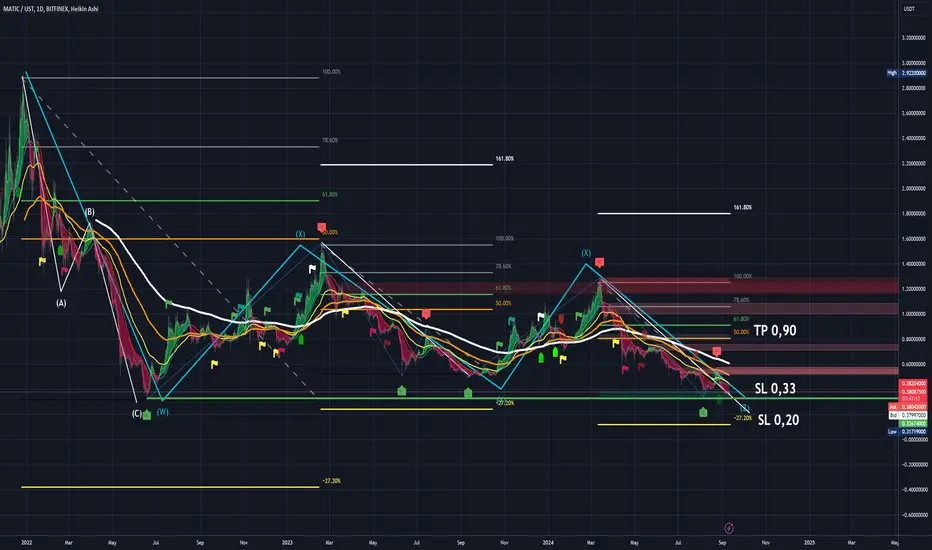
MATICUSDT 1D Fibonacci Analysis
The MATIC-USDT pair disappears and is replaced by the POLUSDT quote.
Nothing changes since POL maintains the 1 to 1 correlation with MATIC, but the MATIC price history disappears from the listings...
In order to have a Technical Analysis of POL, we need the MATIC history. Without MATIC data, we will be investing blindly.
Important levels to take into consideration:
SL 0.33 If we lose this price, POL could go to 0.2 without any major problem.
At the moment, it has respected it and could be building a double bottom and at this level, it has marked exhaustion of the selling force below the 15 RSI level.
TP 0.90 if it respects 0.33, POL could reach 0.90, corresponding to 0.5 / 0.618 of the current bearish trend.

免責事項
これらの情報および投稿は、TradingViewが提供または承認する金融、投資、取引、またはその他の種類の助言もしくは推奨であることを意図したものではなく、またこれらに該当するものでもありません。詳細は利用規約をご覧ください。
免責事項
これらの情報および投稿は、TradingViewが提供または承認する金融、投資、取引、またはその他の種類の助言もしくは推奨であることを意図したものではなく、またこれらに該当するものでもありません。詳細は利用規約をご覧ください。