MCOUSD
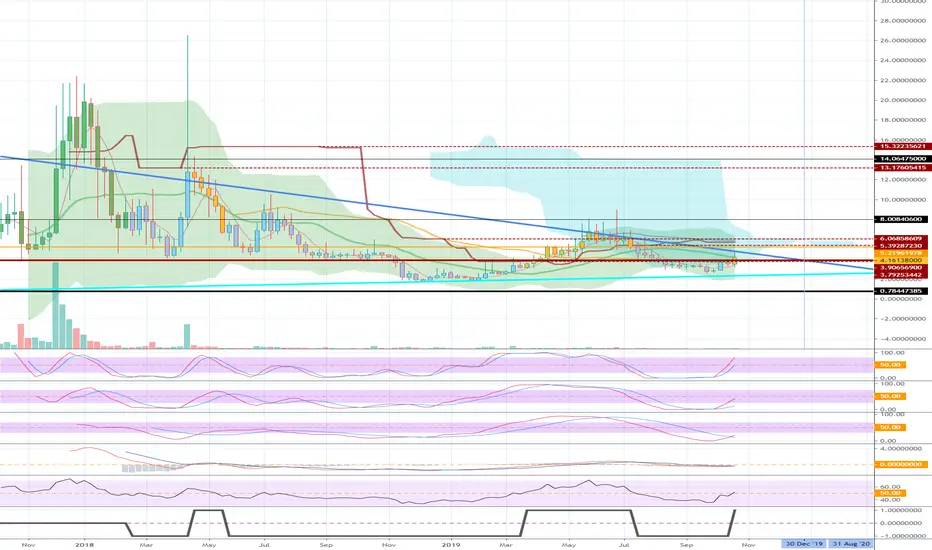
The MCO, a chart published for next year's profits, also rose above the basic 3.90656900 following the rise in BTC.
The price is currently forming around 20MA on the weekly chart.
Once the downtrend line is out and the stock splits slowly between the uptrend line and 3.90656900, we expect good results next year.
The price is currently forming around 20MA on the weekly chart.
Once the downtrend line is out and the stock splits slowly between the uptrend line and 3.90656900, we expect good results next year.

[Practical trading strategy using HA-MS and SBOD]
youtu.be/aceN1AttX1Y
youtu.be/aceN1AttX1Y
関連の投稿
免責事項
これらの情報および投稿は、TradingViewが提供または承認する金融、投資、取引、またはその他の種類の助言もしくは推奨であることを意図したものではなく、またこれらに該当するものでもありません。詳細は利用規約をご覧ください。
[Practical trading strategy using HA-MS and SBOD]
youtu.be/aceN1AttX1Y
youtu.be/aceN1AttX1Y
関連の投稿
免責事項
これらの情報および投稿は、TradingViewが提供または承認する金融、投資、取引、またはその他の種類の助言もしくは推奨であることを意図したものではなく、またこれらに該当するものでもありません。詳細は利用規約をご覧ください。