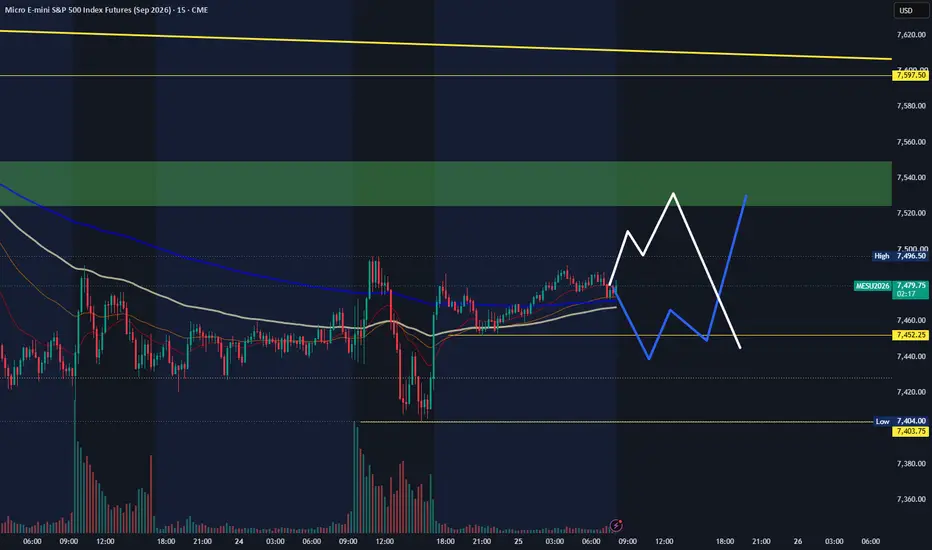
MESU analysis for Thursday, June 25
MESU still looks choppy going into today’s session, and with major news at 8:30, I want to stay patient and focused on reaction levels rather than forcing bias too early.
On the 4H chart, the main higher-time-frame level for me is 7600. If we get a 4H close above 7600, then I think the tone may need to shift from bearish to bullish.
On the downside, I do not want to see price lose the yesterday low around 7400. If that level breaks, then I think price could continue lower toward the next deeper downside level around 7291.
On the 1H chart, the green highlighted order block zone remains the main reaction area I’m watching. That zone still looks important for today.
On the 15M chart, the structure remains choppy, so I want to be patient. One important intraday level I’m watching is 7452, which looks like a meaningful liquidity / reaction point.
Key levels
7600 = higher-time-frame breakout level
7452 = intraday liquidity / reaction level
7400 = yesterday low / key downside level
7291 = deeper downside target
Green zone = order block / reaction area
Plan for today
Respect the choppy structure
Stay patient around the 8:30 news
Watch 7600 for bullish tone shift
Watch 7400 for downside continuation risk
Keep 7452 in mind as an important intraday reaction level
Not financial advice. No confirmation, no trade. MESU2026
MESU still looks choppy going into today’s session, and with major news at 8:30, I want to stay patient and focused on reaction levels rather than forcing bias too early.
On the 4H chart, the main higher-time-frame level for me is 7600. If we get a 4H close above 7600, then I think the tone may need to shift from bearish to bullish.
On the downside, I do not want to see price lose the yesterday low around 7400. If that level breaks, then I think price could continue lower toward the next deeper downside level around 7291.
On the 1H chart, the green highlighted order block zone remains the main reaction area I’m watching. That zone still looks important for today.
On the 15M chart, the structure remains choppy, so I want to be patient. One important intraday level I’m watching is 7452, which looks like a meaningful liquidity / reaction point.
Key levels
7600 = higher-time-frame breakout level
7452 = intraday liquidity / reaction level
7400 = yesterday low / key downside level
7291 = deeper downside target
Green zone = order block / reaction area
Plan for today
Respect the choppy structure
Stay patient around the 8:30 news
Watch 7600 for bullish tone shift
Watch 7400 for downside continuation risk
Keep 7452 in mind as an important intraday reaction level
Not financial advice. No confirmation, no trade.
MESU2026 
免責事項
これらの情報および投稿は、TradingViewが提供または承認する金融、投資、取引、またはその他の種類の助言もしくは推奨であることを意図したものではなく、またこれらに該当するものでもありません。詳細は利用規約をご覧ください。
免責事項
これらの情報および投稿は、TradingViewが提供または承認する金融、投資、取引、またはその他の種類の助言もしくは推奨であることを意図したものではなく、またこれらに該当するものでもありません。詳細は利用規約をご覧ください。