
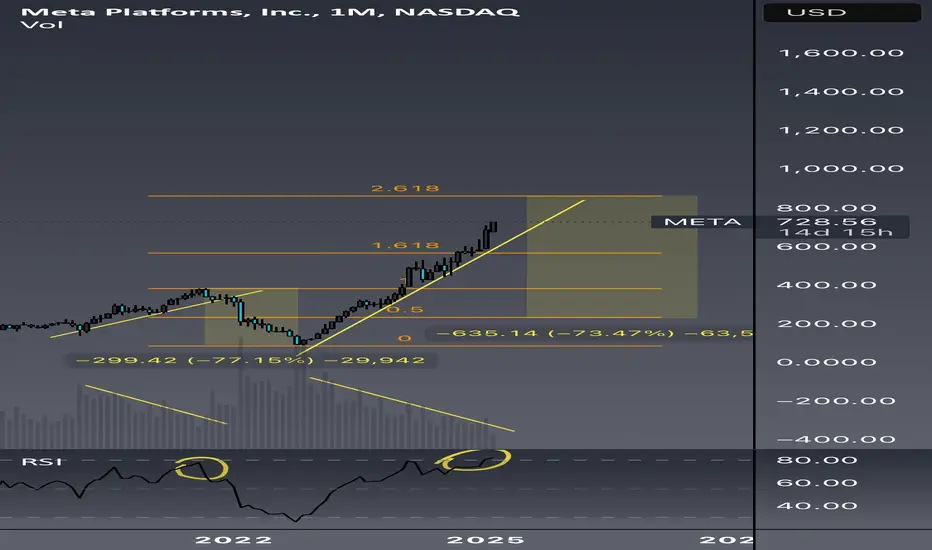
Just a little fun and brainstorming with higher time frame charts. Utilizing RSI, patterns, and time cycles.
Lots of similarities between now and the 2020-2021 bull run. Not to mention a lot of good data suggesting we are close to a recession at best. (Weak housing data/stocks, yield curve uninversion)
What are your thoughts?
Lots of similarities between now and the 2020-2021 bull run. Not to mention a lot of good data suggesting we are close to a recession at best. (Weak housing data/stocks, yield curve uninversion)
What are your thoughts?

免責事項
これらの情報および投稿は、TradingViewが提供または承認する金融、投資、取引、またはその他の種類の助言もしくは推奨であることを意図したものではなく、またこれらに該当するものでもありません。詳細は利用規約をご覧ください。
免責事項
これらの情報および投稿は、TradingViewが提供または承認する金融、投資、取引、またはその他の種類の助言もしくは推奨であることを意図したものではなく、またこれらに該当するものでもありません。詳細は利用規約をご覧ください。