
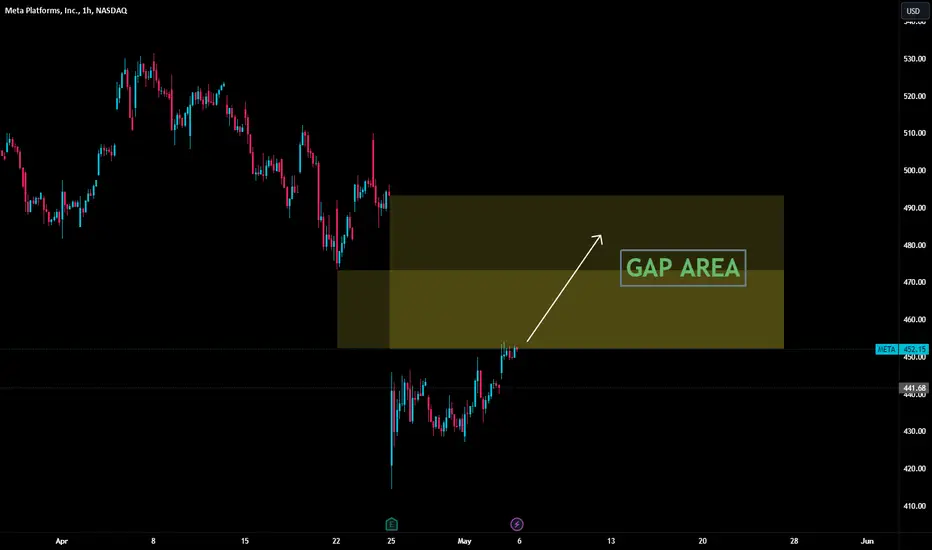
On a 1-hour time frame, observing Meta's price action gap involves noting sudden shifts in opening and closing prices between consecutive candlesticks. This discontinuity signals significant changes in market sentiment and supply-demand dynamics. Traders interpret bullish gaps as positive sentiment and increased buying pressure, while bearish gaps signify negativity and heightened selling pressure. Volume confirmation strengthens the analysis, guiding traders in potential entry or exit points. Effective risk management, including stop-loss orders and proper position sizing, is crucial for mitigating losses.

関連の投稿
免責事項
これらの情報および投稿は、TradingViewが提供または承認する金融、投資、取引、またはその他の種類の助言もしくは推奨であることを意図したものではなく、またこれらに該当するものでもありません。詳細は利用規約をご覧ください。
免責事項
これらの情報および投稿は、TradingViewが提供または承認する金融、投資、取引、またはその他の種類の助言もしくは推奨であることを意図したものではなく、またこれらに該当するものでもありません。詳細は利用規約をご覧ください。