ロング
MFER could melt faces here! KEEP AN EYE ON IT!
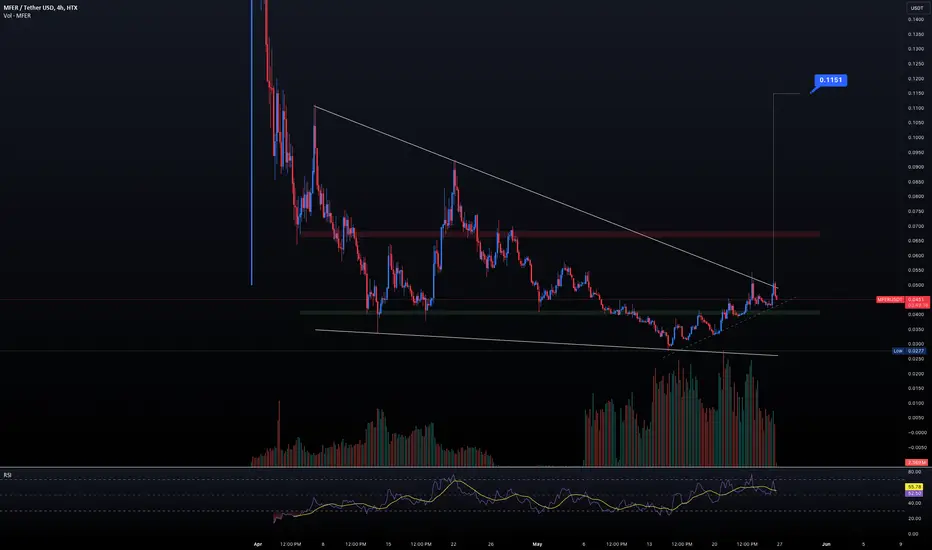
It looks like MFER is about to break out of a two-month-long falling wedge pattern. If the bulls take charge, this could lead to a significant price increase. Unlike many other artist coins, MFER hasn’t experienced a dump at every rally. Instead, it has built a strong range that supports future price action.
Key points:
- Support zones are highlighted in green.
- Resistance zones are highlighted in red.
- The dotted trendline indicates a bullish trend. If it breaks, it will fall into a strong support zone.
This situation is definitely worth watching closely. Let’s see how it develops!
Key points:
- Support zones are highlighted in green.
- Resistance zones are highlighted in red.
- The dotted trendline indicates a bullish trend. If it breaks, it will fall into a strong support zone.
This situation is definitely worth watching closely. Let’s see how it develops!
トレード終了: ストップロスに到達
Looks like holders are trying to exit this token every time there's a substantial movement.
Independent market structure tools and educational chart analysis for learning and review only. Not financial advice.
免責事項
これらの情報および投稿は、TradingViewが提供または承認する金融、投資、取引、またはその他の種類の助言もしくは推奨であることを意図したものではなく、またこれらに該当するものでもありません。詳細は利用規約をご覧ください。
Independent market structure tools and educational chart analysis for learning and review only. Not financial advice.
免責事項
これらの情報および投稿は、TradingViewが提供または承認する金融、投資、取引、またはその他の種類の助言もしくは推奨であることを意図したものではなく、またこれらに該当するものでもありません。詳細は利用規約をご覧ください。