ロング
Possible future path for MGI stock (long term)
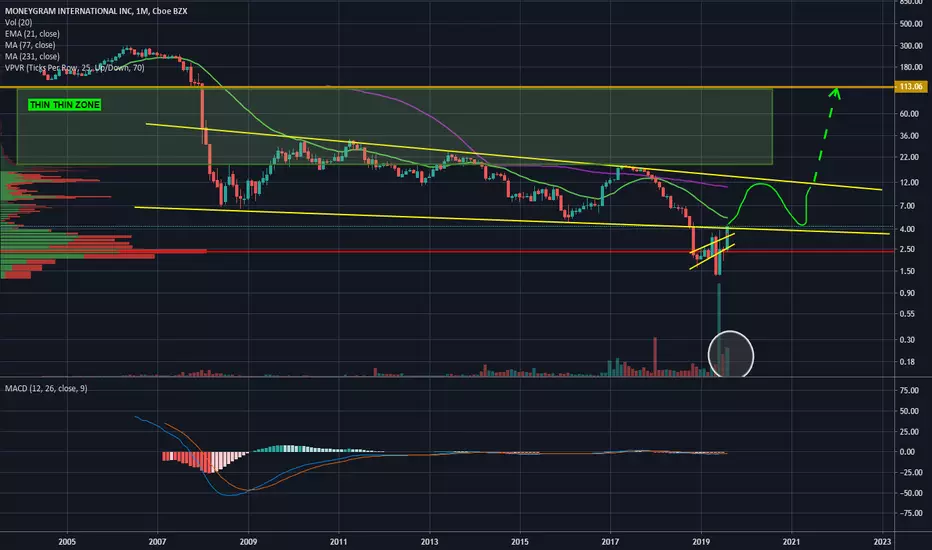
Following reverse symmetry we could bounce rapidely into the falling wedge top resistance and fall back to the recent break out around 4 USD.
This could play out fast since volume becomes thinner above 4 to 5 USD.
After falling back to the base of the (yellow) wedge we could go up for the real break out (above 13 USD).
Thing could start getting REALLY interesting above 13 USD as there is reallly no heavy price history above that level:
in fact, during the great financial crisis MGI stock cratered from around 300 to 20 USD almost in straight line !!
Please feel free to share or to make comments about that outcome. Comments and discussions are welcome !!
This could play out fast since volume becomes thinner above 4 to 5 USD.
After falling back to the base of the (yellow) wedge we could go up for the real break out (above 13 USD).
Thing could start getting REALLY interesting above 13 USD as there is reallly no heavy price history above that level:
in fact, during the great financial crisis MGI stock cratered from around 300 to 20 USD almost in straight line !!
Please feel free to share or to make comments about that outcome. Comments and discussions are welcome !!
トレード稼働中
There was a gap between 4.12 and 4.28. Today it has been filled.This constitutes a buying opportunity.
トレード稼働中
Confirmation: price gapped up above resistance with decent volume.
免責事項
これらの情報および投稿は、TradingViewが提供または承認する金融、投資、取引、またはその他の種類の助言もしくは推奨であることを意図したものではなく、またこれらに該当するものでもありません。詳細は利用規約をご覧ください。
免責事項
これらの情報および投稿は、TradingViewが提供または承認する金融、投資、取引、またはその他の種類の助言もしくは推奨であることを意図したものではなく、またこれらに該当するものでもありません。詳細は利用規約をご覧ください。