ロング
MMAT
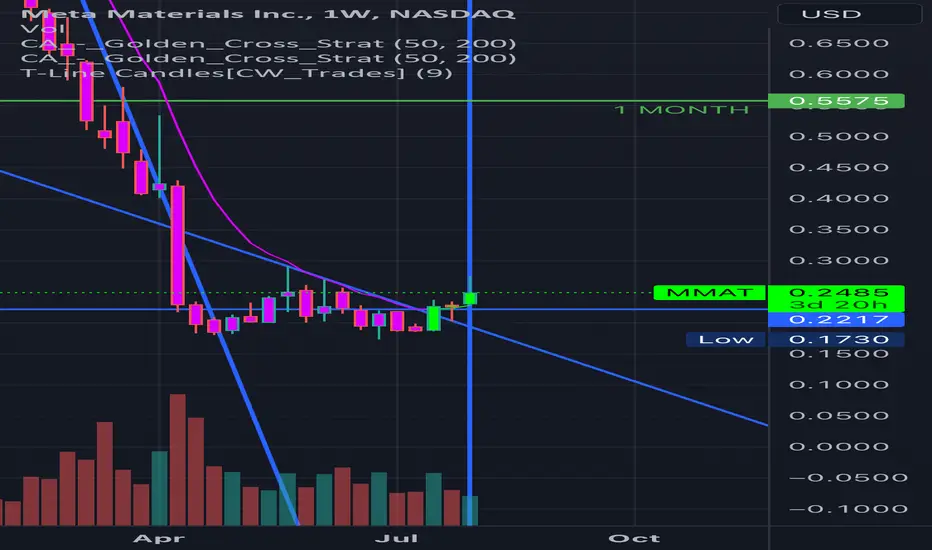
$NASDAQ:MMAT Has Recently crossed on weekly timeframe I’ve been using for trading. Very bullish.
Nearly every time it has crossed it has then run to the monthly (trigger yellow) which gives 1-3 MONTHS OF bullish activity consistently.
It has ran its course down and into accumulation past few weeks and officially broken out on my levels.
A close under 0.22 can invalidate the whole thing IMO.
Running PLENTY of long dated October and jan24 0.50 calls. Looking further possibly.
Looking very very strong here.
Nearly every time it has crossed it has then run to the monthly (trigger yellow) which gives 1-3 MONTHS OF bullish activity consistently.
It has ran its course down and into accumulation past few weeks and officially broken out on my levels.
A close under 0.22 can invalidate the whole thing IMO.
Running PLENTY of long dated October and jan24 0.50 calls. Looking further possibly.
Looking very very strong here.

免責事項
これらの情報および投稿は、TradingViewが提供または承認する金融、投資、取引、またはその他の種類の助言もしくは推奨であることを意図したものではなく、またこれらに該当するものでもありません。詳細は利用規約をご覧ください。
免責事項
これらの情報および投稿は、TradingViewが提供または承認する金融、投資、取引、またはその他の種類の助言もしくは推奨であることを意図したものではなく、またこれらに該当するものでもありません。詳細は利用規約をご覧ください。