
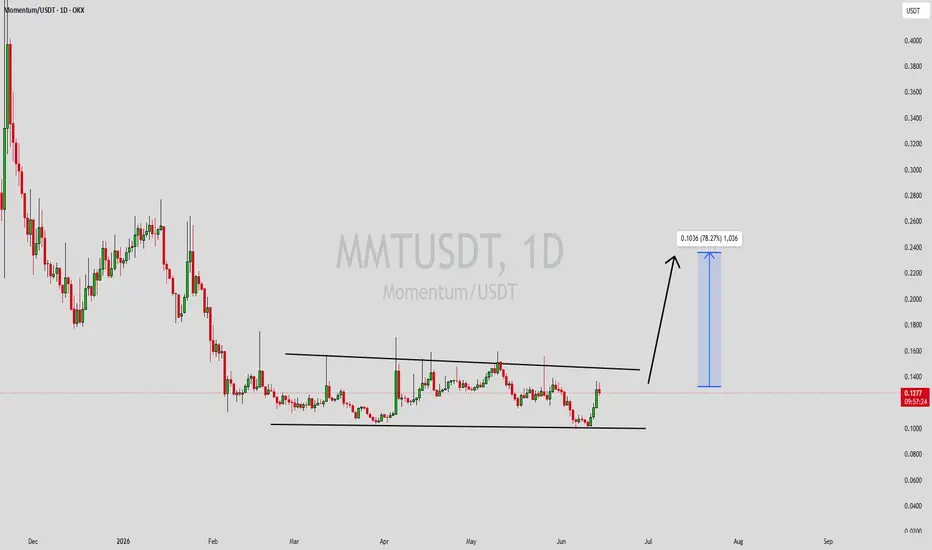
MMTUSDT is forming a clear falling wedge pattern, a classic bullish wave signal that often indicates an upcoming breakout. The price has been consolidating within a narrowing range, suggesting that selling pressure is weakening while buyers are beginning to regain control. With consistent volume confirming accumulation at lower levels, the setup hints at a potential bullish breakout soon. The projected move could lead to an impressive gain of around 60% to 70% once the price breaks above the wedge resistance.
This falling wedge pattern is typically seen at the end of downtrends or corrective phases, and it represents a potential shift in market sentiment from bearish to bullish. Traders closely watching MMTUSDT are noting the strengthening momentum as it nears a breakout zone. The healthy trading volume adds confidence to this pattern, showing that market participants are positioning early in anticipation of a reversal.
Investors’ growing interest in MMTUSDT reflects rising confidence in the project's long-term fundamentals and current technical strength. If the breakout confirms with sustained volume, this could mark the beginning of a fresh bullish leg. Traders may find this setup attractive for medium-term opportunities, especially as the falling wedge pattern approaches completion and buying momentum continues to build.
✅ Show your support by hitting the like button!
✅ Leave a comment below! (What is your opinion about this coin?)
Your feedback and engagement keep me motivated to share more insightful market analysis with you!
This falling wedge pattern is typically seen at the end of downtrends or corrective phases, and it represents a potential shift in market sentiment from bearish to bullish. Traders closely watching MMTUSDT are noting the strengthening momentum as it nears a breakout zone. The healthy trading volume adds confidence to this pattern, showing that market participants are positioning early in anticipation of a reversal.
Investors’ growing interest in MMTUSDT reflects rising confidence in the project's long-term fundamentals and current technical strength. If the breakout confirms with sustained volume, this could mark the beginning of a fresh bullish leg. Traders may find this setup attractive for medium-term opportunities, especially as the falling wedge pattern approaches completion and buying momentum continues to build.
✅ Show your support by hitting the like button!
✅ Leave a comment below! (What is your opinion about this coin?)
Your feedback and engagement keep me motivated to share more insightful market analysis with you!

🟢🟢🟢🟢🟢🟢 🟢🟢🟢Join Our Telegram Here to Get Trades With Entry And Exit 🟢🟢🟢
👇👇👇👇👇👇
linktr.ee/TelegramChannel777
🟢🟢🟢
👇👇👇👇👇👇
linktr.ee/TelegramChannel777
🟢🟢🟢
免責事項
これらの情報および投稿は、TradingViewが提供または承認する金融、投資、取引、またはその他の種類の助言もしくは推奨であることを意図したものではなく、またこれらに該当するものでもありません。詳細は利用規約をご覧ください。
🟢🟢🟢🟢🟢🟢 🟢🟢🟢Join Our Telegram Here to Get Trades With Entry And Exit 🟢🟢🟢
👇👇👇👇👇👇
linktr.ee/TelegramChannel777
🟢🟢🟢
👇👇👇👇👇👇
linktr.ee/TelegramChannel777
🟢🟢🟢
免責事項
これらの情報および投稿は、TradingViewが提供または承認する金融、投資、取引、またはその他の種類の助言もしくは推奨であることを意図したものではなく、またこれらに該当するものでもありません。詳細は利用規約をご覧ください。