
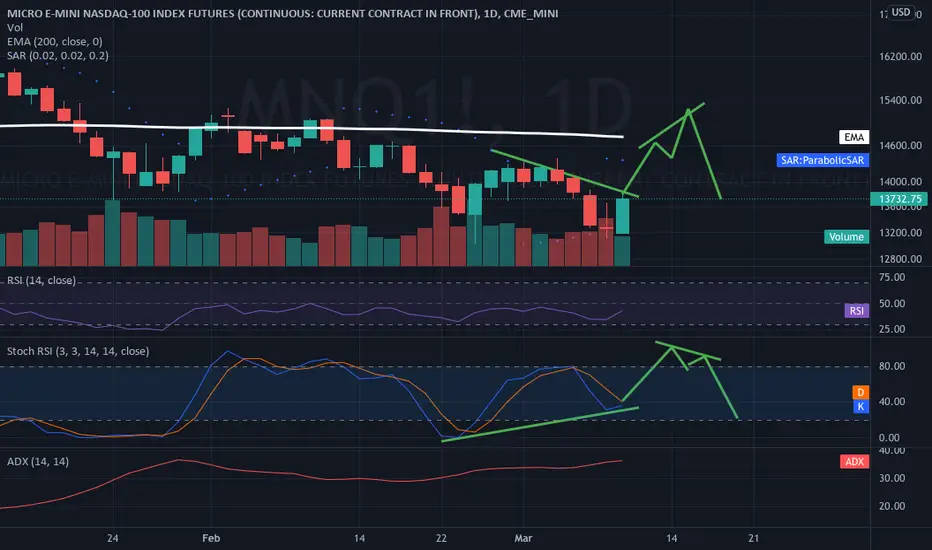
Here is an idea of what may happen. This is not a prediction but more of a tutorial in what to look for in the daily time frame of negative divergence.
Of course this could be wrong and the bulls buy this to ATHs (all time highs) but I suspect the markets will sell off eventually. And this chart will prepare you
to look for evidence that the markets will turn down on the daily time frame.
Of course this could be wrong and the bulls buy this to ATHs (all time highs) but I suspect the markets will sell off eventually. And this chart will prepare you
to look for evidence that the markets will turn down on the daily time frame.
ノート
That did not move according to plan. That happens. Monthly stll oversold so I will just stay out for now. Zigzags is where I tend to lose.
免責事項
これらの情報および投稿は、TradingViewが提供または承認する金融、投資、取引、またはその他の種類の助言もしくは推奨であることを意図したものではなく、またこれらに該当するものでもありません。詳細は利用規約をご覧ください。
免責事項
これらの情報および投稿は、TradingViewが提供または承認する金融、投資、取引、またはその他の種類の助言もしくは推奨であることを意図したものではなく、またこれらに該当するものでもありません。詳細は利用規約をご覧ください。