
Hey guys,
Yearly chart: Bullish Eng.
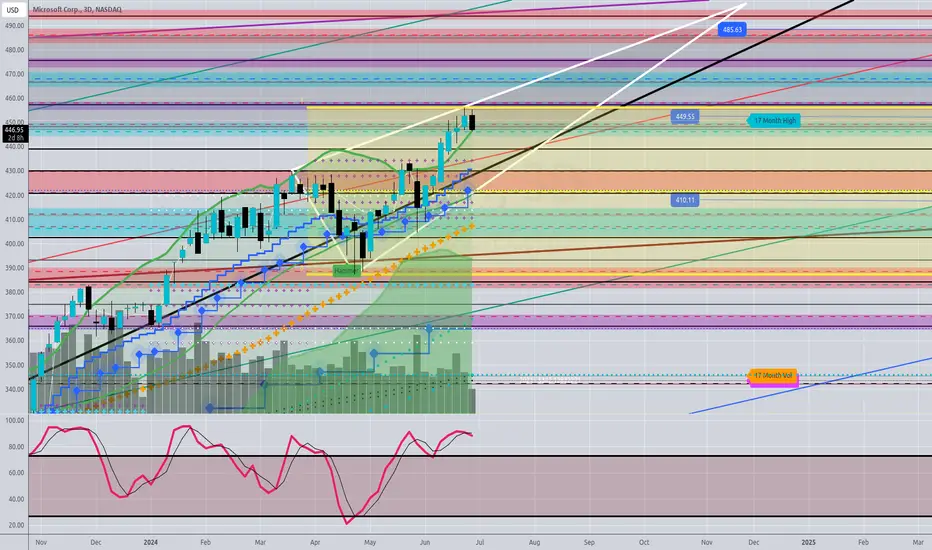
--> Strong Resistance at 449 and 522
--> This is the first point where some Profit taking could come.
Quarterly: Bullish - although gains are weak compared to the months before.
Monthly: Bullish Candle
--> Stochastic bearish Divergence
--> Bullish Trendline intact
3D: Ascending Triangle Formation
--> break above would be extremely bullish because Bears are meant to take over.
Target Bulls: 485 - 582
Target bears: 410 - 388
Thanks for reading…
Yearly chart: Bullish Eng.
--> Strong Resistance at 449 and 522
--> This is the first point where some Profit taking could come.
Quarterly: Bullish - although gains are weak compared to the months before.
Monthly: Bullish Candle
--> Stochastic bearish Divergence
--> Bullish Trendline intact
3D: Ascending Triangle Formation
--> break above would be extremely bullish because Bears are meant to take over.
Target Bulls: 485 - 582
Target bears: 410 - 388
Thanks for reading…

関連の投稿
免責事項
これらの情報および投稿は、TradingViewが提供または承認する金融、投資、取引、またはその他の種類の助言もしくは推奨であることを意図したものではなく、またこれらに該当するものでもありません。詳細は利用規約をご覧ください。
免責事項
これらの情報および投稿は、TradingViewが提供または承認する金融、投資、取引、またはその他の種類の助言もしくは推奨であることを意図したものではなく、またこれらに該当するものでもありません。詳細は利用規約をご覧ください。