
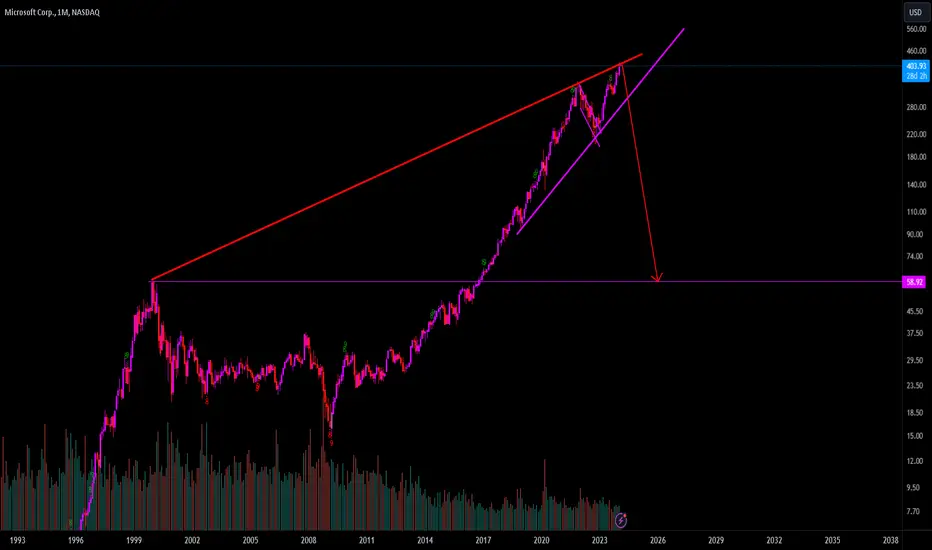
This kind a lines up with all my other charts for a massive bubble pop. Unless there is a stick save somehow this is all going to unravel. MSFT had a throw over of the 2000 & 2021 top (red line) and back under which is very bearish.
I posted a zoomed in picture below.
I posted a zoomed in picture below.
ノート

Don't speculate or listen to the news, it's all in the charts.
免責事項
これらの情報および投稿は、TradingViewが提供または承認する金融、投資、取引、またはその他の種類の助言もしくは推奨であることを意図したものではなく、またこれらに該当するものでもありません。詳細は利用規約をご覧ください。
Don't speculate or listen to the news, it's all in the charts.
免責事項
これらの情報および投稿は、TradingViewが提供または承認する金融、投資、取引、またはその他の種類の助言もしくは推奨であることを意図したものではなく、またこれらに該当するものでもありません。詳細は利用規約をご覧ください。