
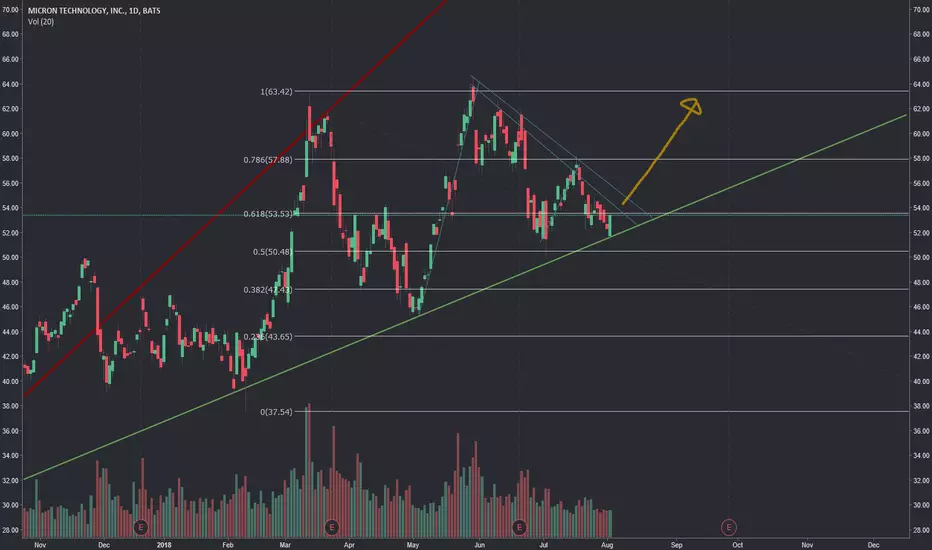
Please point out the wrongs with this analysis. Arguments of an unforeseeable event are going straight into the trash if they aren't substantiated by anything, like for instance change in sentiment.
Argument 1:

Past couple of runs have started with touching the support as highlighted in the image above.
Argument 2:

Past couple of runs have, roughly speaking, started in-between earnings.
Argument 3:

The stock has had a tendency to make a run, touch the resistance, reverse, retrace(in the reversal) and then run again. Assuming that the behaviour will continue, we should expect the start of a run right now. Note that there is relatively high volume around the 63.42 resistance which would make it a good exit point,
Argument 4:

MACD is converging which might signal the beginning of a run. With that being said the MACD's last signal was false as it was a retracement.
Argument 5+6:

The stochastic oscillator is indicating the beginning of a run.
The light blue blocky line is the RSI and has bottomed seems to have bottomed considering historical reversals that indicate the bottom to be around 35-40%.
Again, critique encouraged.
Cheers!
Argument 1:
Past couple of runs have started with touching the support as highlighted in the image above.
Argument 2:
Past couple of runs have, roughly speaking, started in-between earnings.
Argument 3:
The stock has had a tendency to make a run, touch the resistance, reverse, retrace(in the reversal) and then run again. Assuming that the behaviour will continue, we should expect the start of a run right now. Note that there is relatively high volume around the 63.42 resistance which would make it a good exit point,
Argument 4:
MACD is converging which might signal the beginning of a run. With that being said the MACD's last signal was false as it was a retracement.
Argument 5+6:
The stochastic oscillator is indicating the beginning of a run.
The light blue blocky line is the RSI and has bottomed seems to have bottomed considering historical reversals that indicate the bottom to be around 35-40%.
Again, critique encouraged.
Cheers!
ノート
Argument 7:A bullish ascending triangle has formed which is traditionally characterized by at least two bounces from the upper horizontal line as well as two bounces from the ascending lower trend line. The volume should also be contracting.
Micron is matching the aforementioned description perfectly.

免責事項
これらの情報および投稿は、TradingViewが提供または承認する金融、投資、取引、またはその他の種類の助言もしくは推奨であることを意図したものではなく、またこれらに該当するものでもありません。詳細は利用規約をご覧ください。
免責事項
これらの情報および投稿は、TradingViewが提供または承認する金融、投資、取引、またはその他の種類の助言もしくは推奨であることを意図したものではなく、またこれらに該当するものでもありません。詳細は利用規約をご覧ください。