
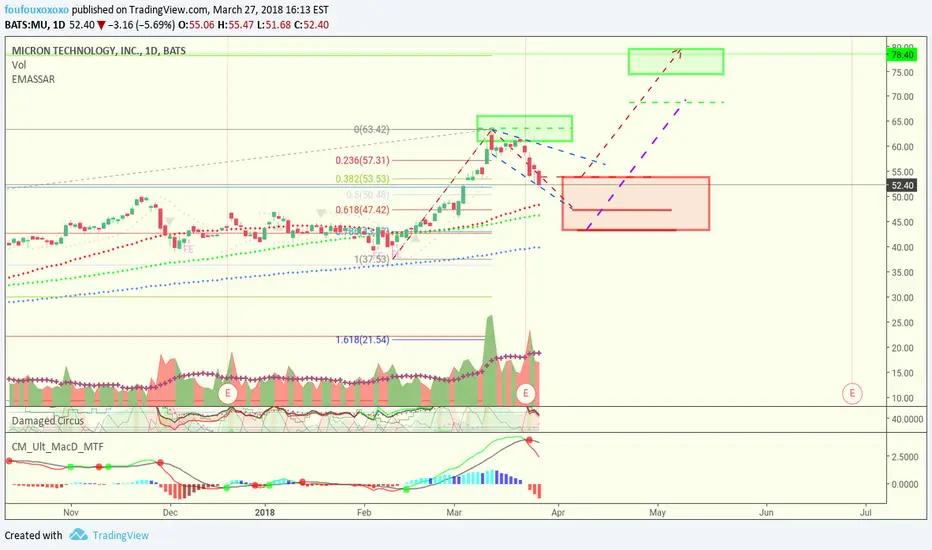
previous targets 63.5 were reached, the bullflag stopping @ 1.61 fibonacci.
Now most probable fall is same as before @47.5 coinciding with the 50 &100 ema. But we could have a ping pong in trend range( blue lines) or inside the support/resistance 38-61 fib. If this support fails then 43.6 is the lowest level to watch for reversal.
The longer trend excluding a major crisis, looks bullish and the target is the same at 78-80 with a pause @65-68, for now we will be waiting for long term confirmation either with a strong rebound at the previous mentioned levels or breaking above the blue channel ~59.
Now most probable fall is same as before @47.5 coinciding with the 50 &100 ema. But we could have a ping pong in trend range( blue lines) or inside the support/resistance 38-61 fib. If this support fails then 43.6 is the lowest level to watch for reversal.
The longer trend excluding a major crisis, looks bullish and the target is the same at 78-80 with a pause @65-68, for now we will be waiting for long term confirmation either with a strong rebound at the previous mentioned levels or breaking above the blue channel ~59.

関連の投稿
免責事項
これらの情報および投稿は、TradingViewが提供または承認する金融、投資、取引、またはその他の種類の助言もしくは推奨であることを意図したものではなく、またこれらに該当するものでもありません。詳細は利用規約をご覧ください。
関連の投稿
免責事項
これらの情報および投稿は、TradingViewが提供または承認する金融、投資、取引、またはその他の種類の助言もしくは推奨であることを意図したものではなく、またこれらに該当するものでもありません。詳細は利用規約をご覧ください。